Checking RNA quality with Bioanalyzer
I used the Bioanalyzer RNA 6000 pico assay to check quality of a few RNA samples. RNA samples analyzed:
The following are samples I am using to both check RNA quality, and to test the QuantSeq library prep protocol. I am testing samples from a variety of cohorts, treatments, tissue type. The RNA concentrations also vary a bit.
| Cohort | Treatment | Tissue | RNA Sample # | [RNA] after Dnase treatment (ng/uL) | ng RNA in 5uL (QuantSeq max vol) |
|---|---|---|---|---|---|
| Dabob Bay | 6 Low High | Ctenidia | 296 | 180.0 | 900.0 |
| Oyster Bay | 6 Ambient | Ctenidia | 323 | 102.0 | 510.0 |
| Fidalgo Bay | 6 Ambient | Ctenidia | 341 | 89.6 | 448.0 |
| Dabob Bay | 10 Ambient | Larvae | 403 | 136.0 | 680 |
| Fidalgo Bay | 6 Low | Larvae | 472b | 97.0 | 485 |
| Oyster Bay C1 | 10 Ambient | Larvae | 490 | 186.0 | 930 |
| Oyster Bay C1 | 6 Ambient | Larvae | 513 | 142.0 | 710 |
| Oyster Bay C2 | 10 Ambient | Larvae | 531 | 95.4 | 477 |
I pulled 10uL from the samples into newly labeled tubes for all future testing of protocol, quality, etc.
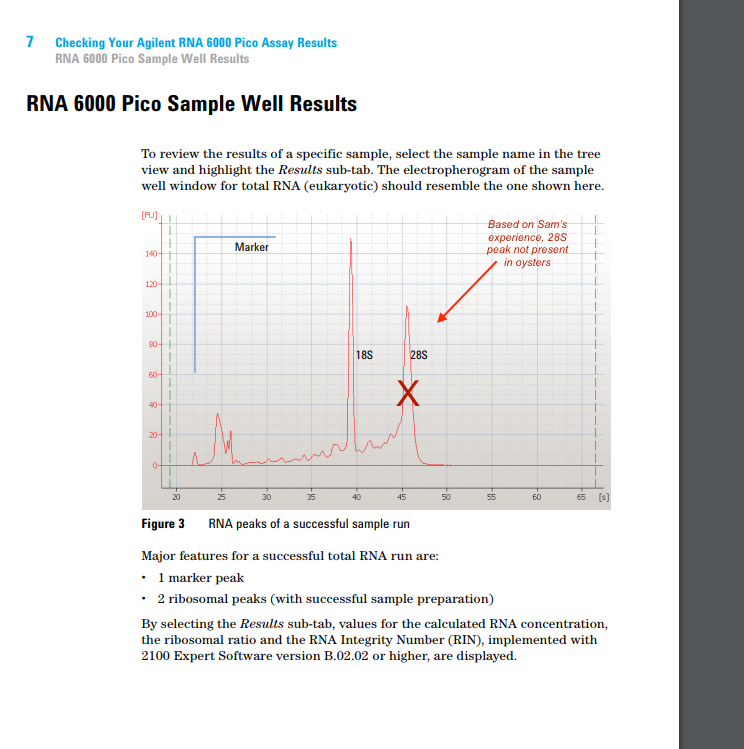
Following the RNA 600 Pico Chip manual, and with help from Sam, I ran these 8 samples on the Bioanalyzer. Results file is located in my quantseq github repo. I consulted with Sam, and it looks like my RNA is not degraded. According to Sam, oyster 28S ribosomal RNA isn’t usually present in Bionanalyzer results, which precludes using RIN as quality scores since it’s calculated based on the 18S/28S ratio. So, I am basing my QA on Sam’s visual assessment of the gels and peaks. Conclusion: RNA quality looks fine.
From the manual, what a high quality sample should produce:
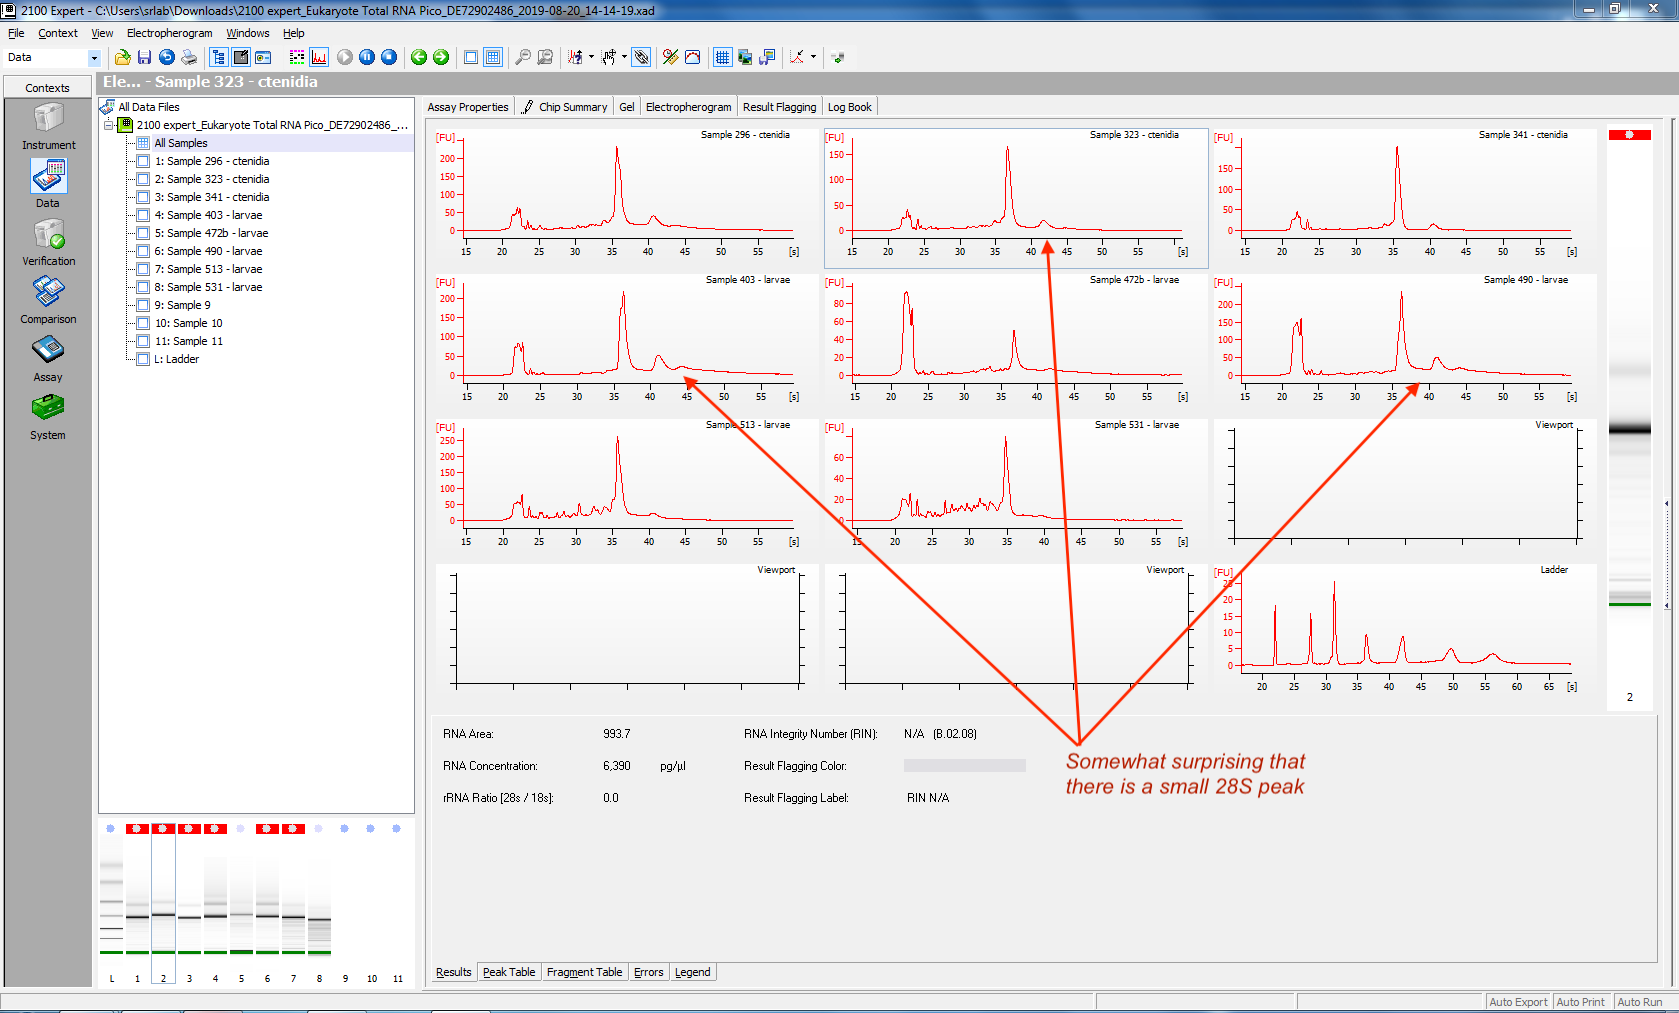
My electropherogram results:
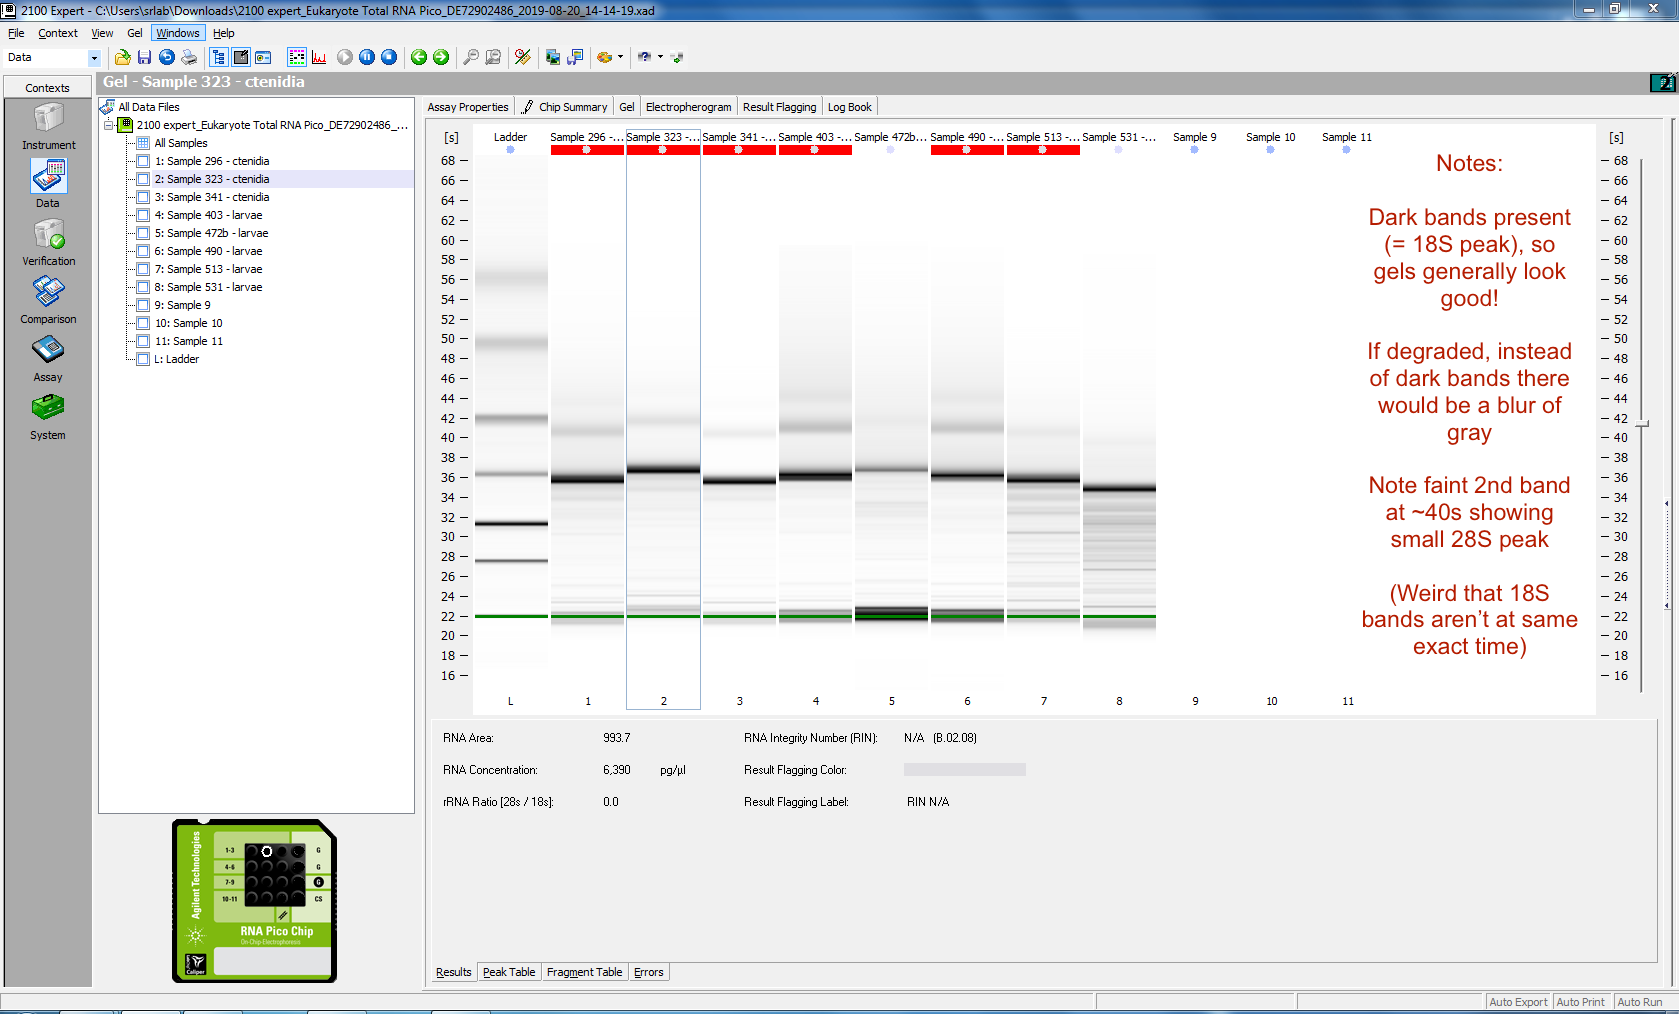
Same results, visualized as bands on a gel