
O. lurida QuantSeq - initial analysis
Finally got back to my O. lurida gene expression analysis, aka the QuantSeq data. For a quick reminder, I am examining the effect of parental exposure to acidification on gene expression in 1) parent’s gill tissue, 2) larval whole body tissue upon maternal liberation, and 3) juvenile whole body tissue after 1 year in common conditions then 3 months deployed in Port Gamble Bay. For all three tissues/stages, I have multiple populations (Fidalgo Bay (1, 2 & 3), Dabob Bay (1, 2 & 3), Oyster Bay (1 & 2).
Last year I tested various pipelines for trim/filtering and aligning the reads - check out my Jupyter Notebook “2020-QuantSeq-Testing-Pipelines.ipynb” for more details. One of the big decisions was which aligner to use. I ultimately chose to use Bowtie2 against the O. lurida genome - that resulted in the best alignment rate. For all steps from raw read processing to gene counts, see my Jupyter Notebook “2020-QuantSeq-Processing_Raw-to-Counts.ipynb”.
In the past week-ish I have filtered out poor quality samples, and completed an initial DE analysis of all the tissue types using DESeq2. All was done in R - my notebooks are numbered, and will show up here (O.lurida_QuantSeq-2020/notebooks/) Here’s a synopsis:
Discarded poor quality samples, those possibly plagued by duplicates
Here’s the total # sequences I have in each of my 147 samples.
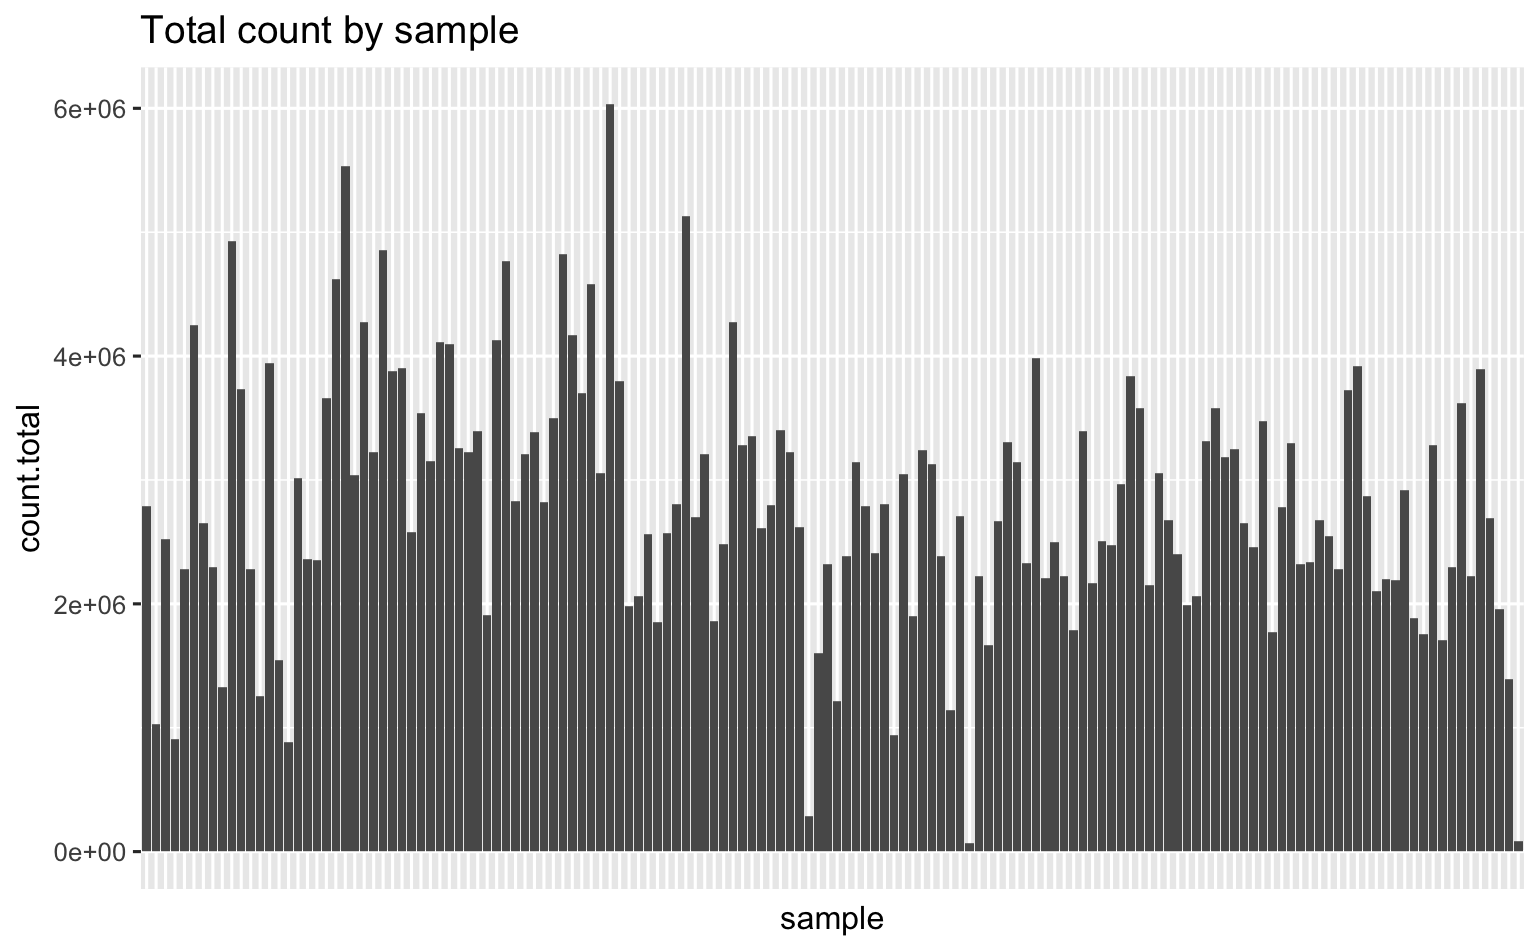
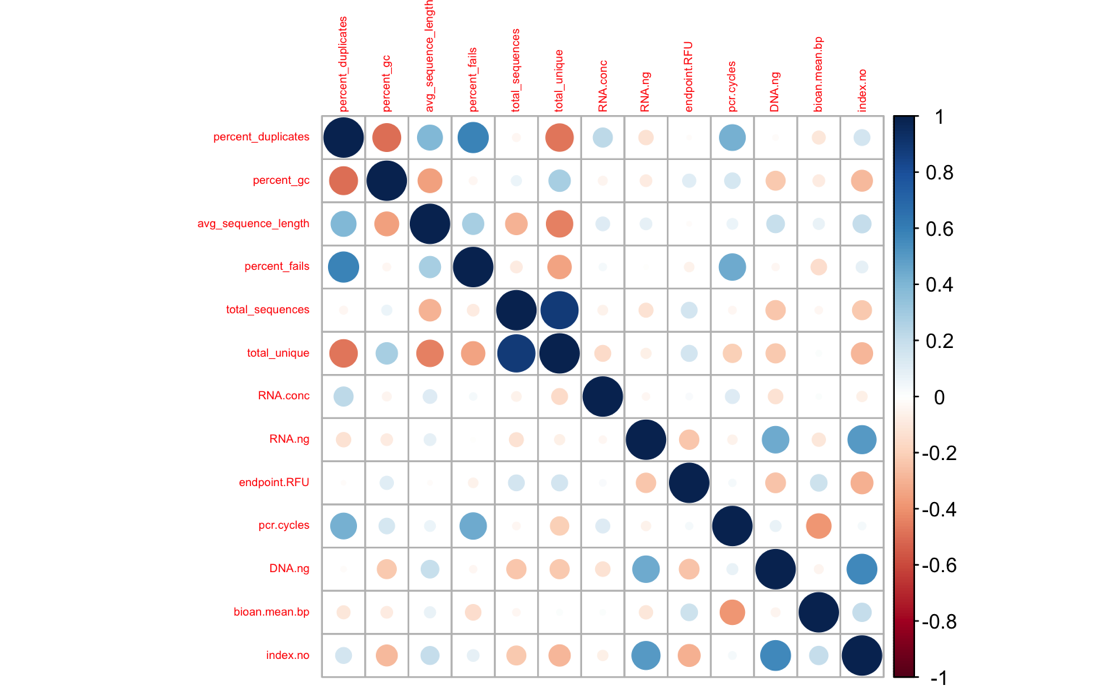
Some of my librares resulted in very few reads, and very high duplicate rates (according to fastqc). To explore relationships between sequencing stats and library prep stats, I generated a corrplot.
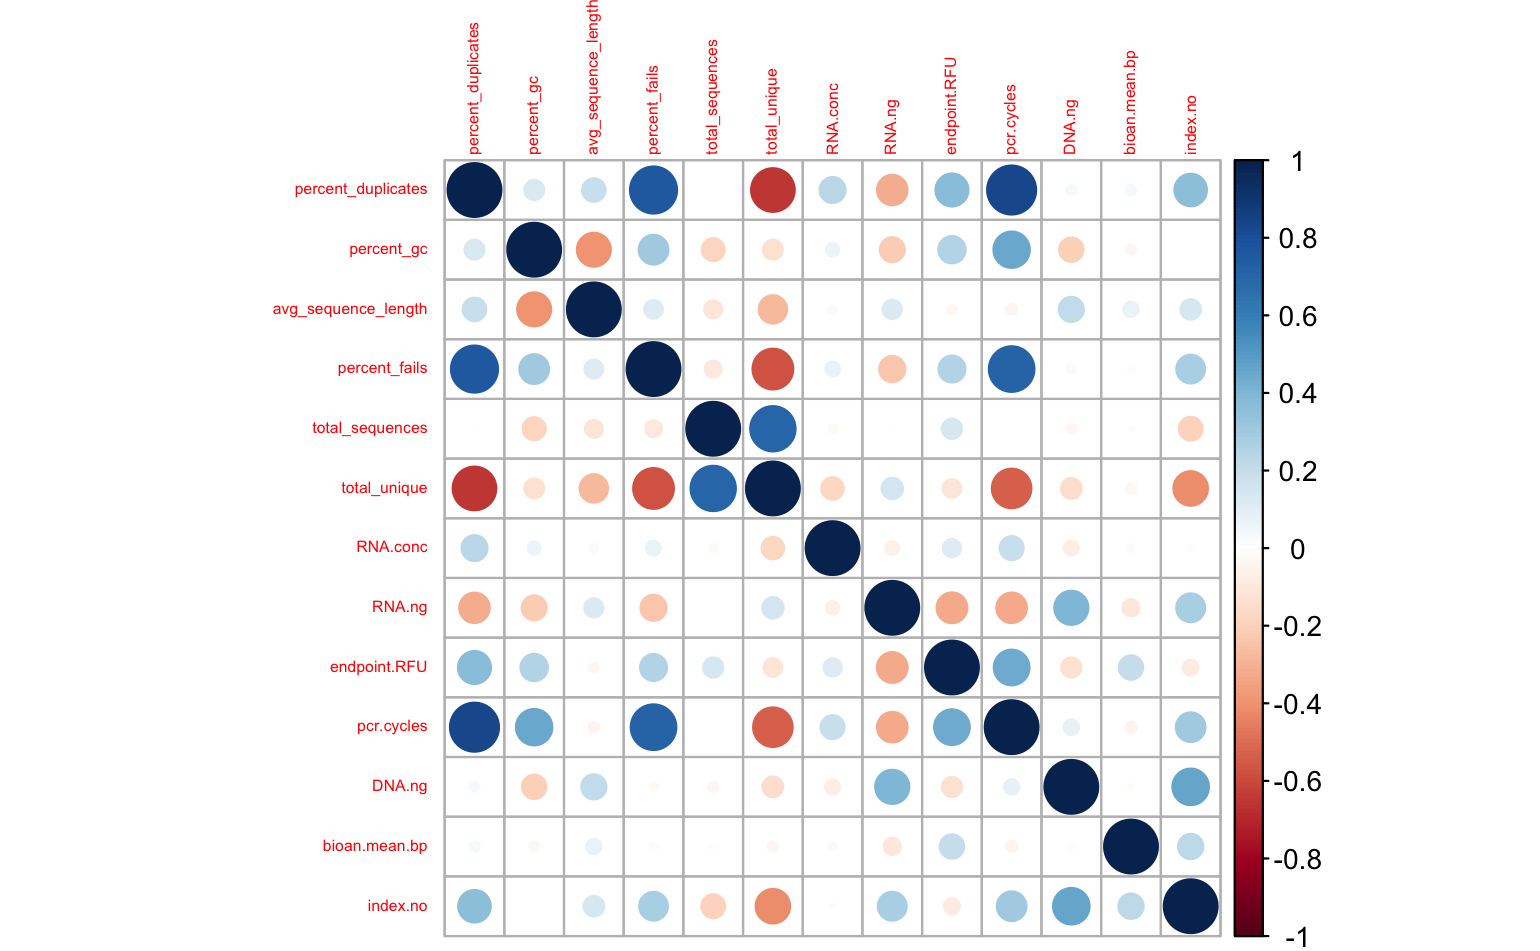
It certainly looks like the # pcr cycles influenced my libraries - No. of PCR cycles strongly correlates positively % duplicates & % fails, and negatively with total unique reads, less strongly with GC content. I’m most concerned about the prevalence of PCR duplicates, so let’s look at that more closely.
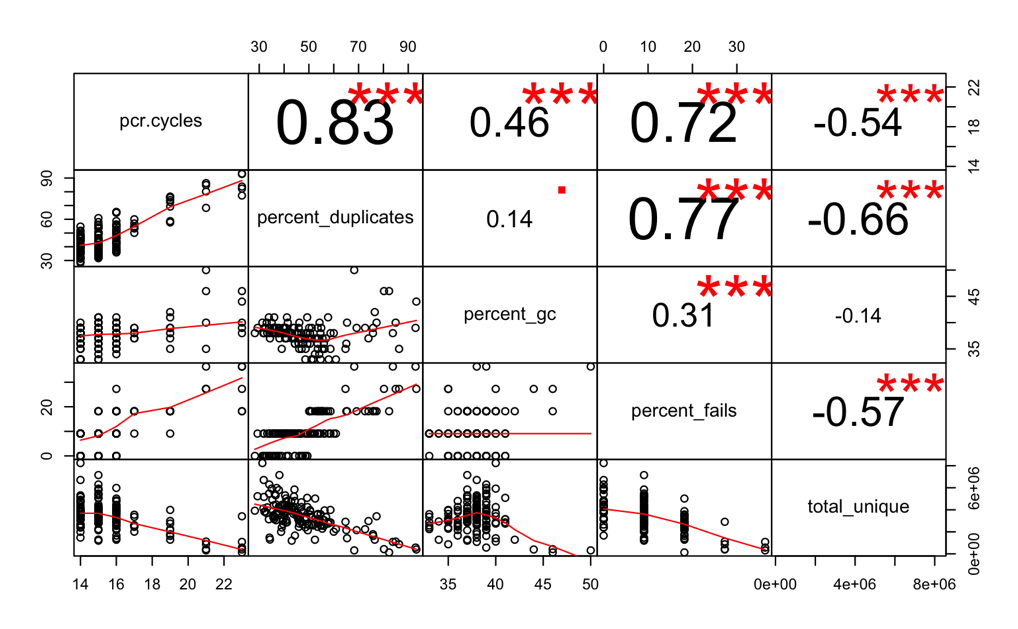
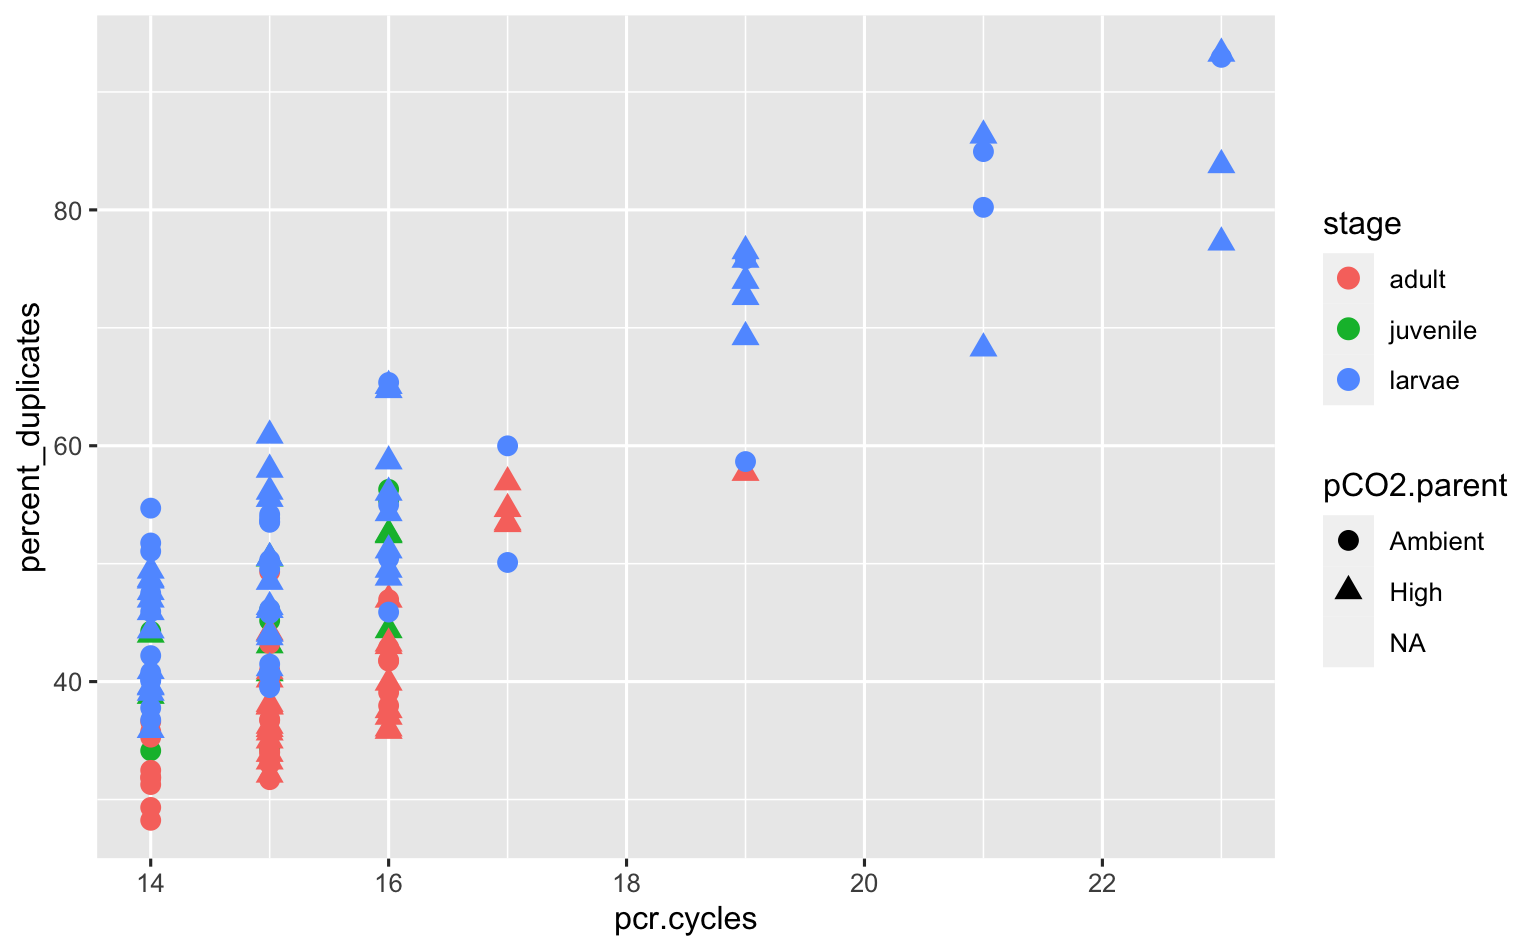
Wow- quite the trend! I do not feel comfortable keeping any of the libraries that needed >17 pcr cycles. I’m going to discard those, then check out the corrplot again.
Here’s the distribution of the samples that I’m going to throw out: | adult | Fidalgo Bay | High | 1 | | |-|-|-|-|-| | larvae | Dabob Bay | High | 2 | | | larvae | Fidalgo Bay | Ambient | 2 | | | larvae | Negative control | NA | 1 | | | larvae | Oyster Bay C1 | Ambient | 3 | | | larvae | Oyster Bay C1 | High | 5 | | | larvae | Oyster Bay C2 | High | 3 | |
After discarding samples with high PCR cycles, here’s what will remain. I’m happy with that - the only comparison that is very unbalanced between parental pCO2 exposure is the Fidalgo Bay larvae (bummer).
| Stage/Tissue | Population | Parental pCO2 | n |
|---|---|---|---|
| adult | Dabob Bay | Ambient | 9 |
| adult | Dabob Bay | High | 8 |
| adult | Fidalgo Bay | Ambient | 9 |
| adult | Fidalgo Bay | High | 8 |
| adult | Oyster Bay C1 | Ambient | 9 |
| adult | Oyster Bay C1 | High | 9 |
| juvenile | Dabob Bay | Ambient | 4 |
| juvenile | Dabob Bay | High | 4 |
| juvenile | Fidalgo Bay | Ambient | 4 |
| juvenile | Fidalgo Bay | High | 4 |
| larvae | Dabob Bay | Ambient | 5 |
| larvae | Dabob Bay | High | 5 |
| larvae | Fidalgo Bay | Ambient | 5 |
| larvae | Fidalgo Bay | High | 10 |
| larvae | Oyster Bay C1 | Ambient | 13 |
| larvae | Oyster Bay C1 | High | 11 |
| larvae | Oyster Bay C2 | Ambient | 7 |
| larvae | Oyster Bay C2 | High | 5 |
Adult ctendia tissue, differential expression analysis
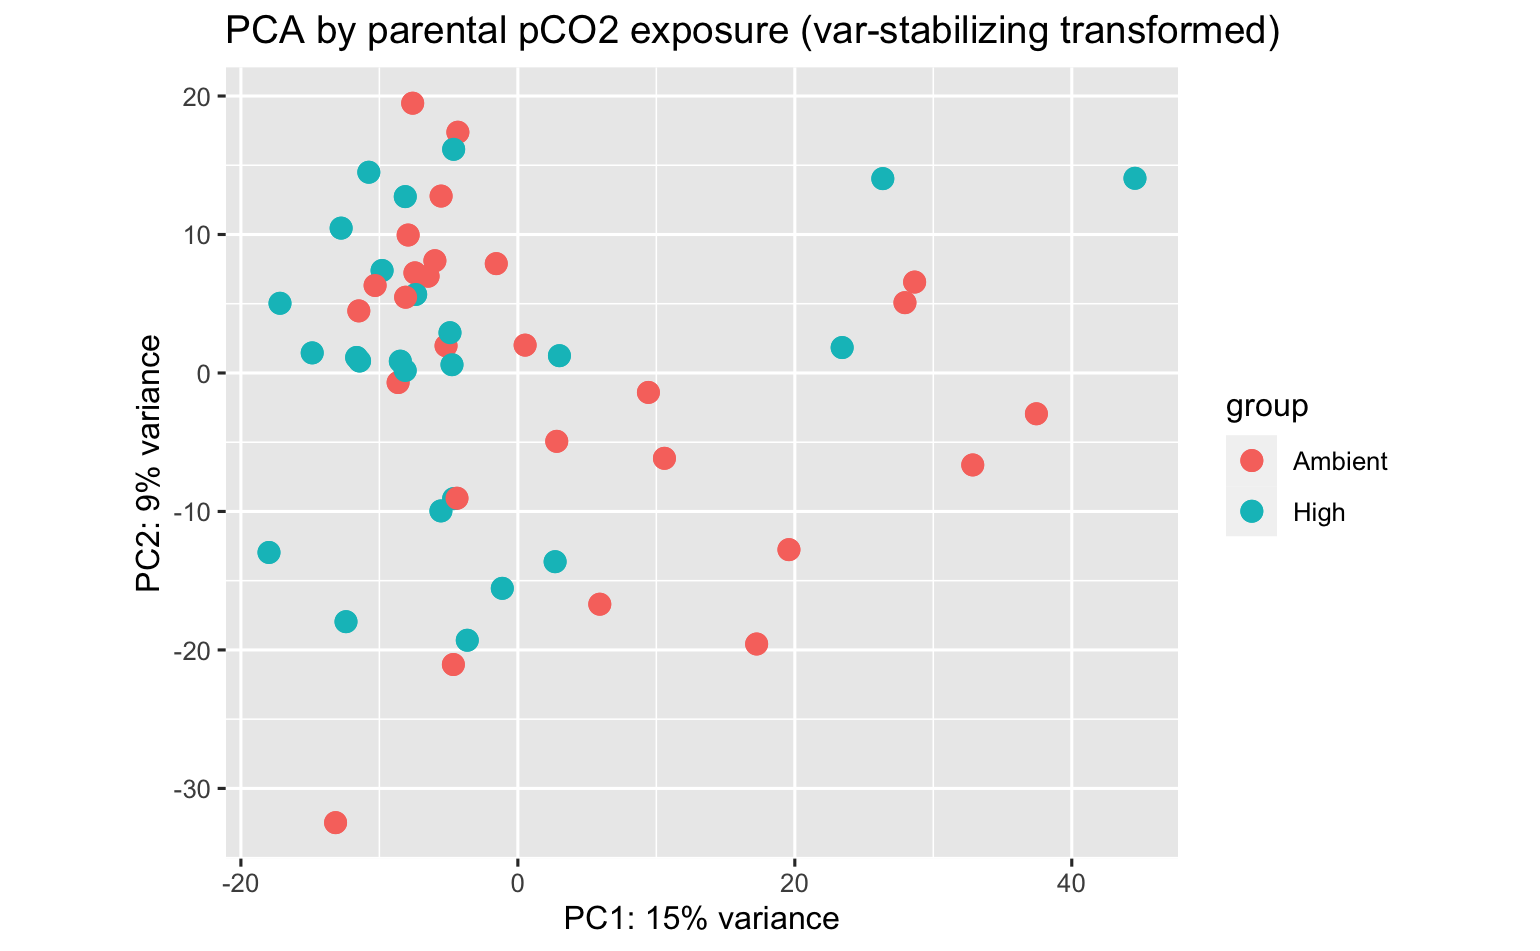
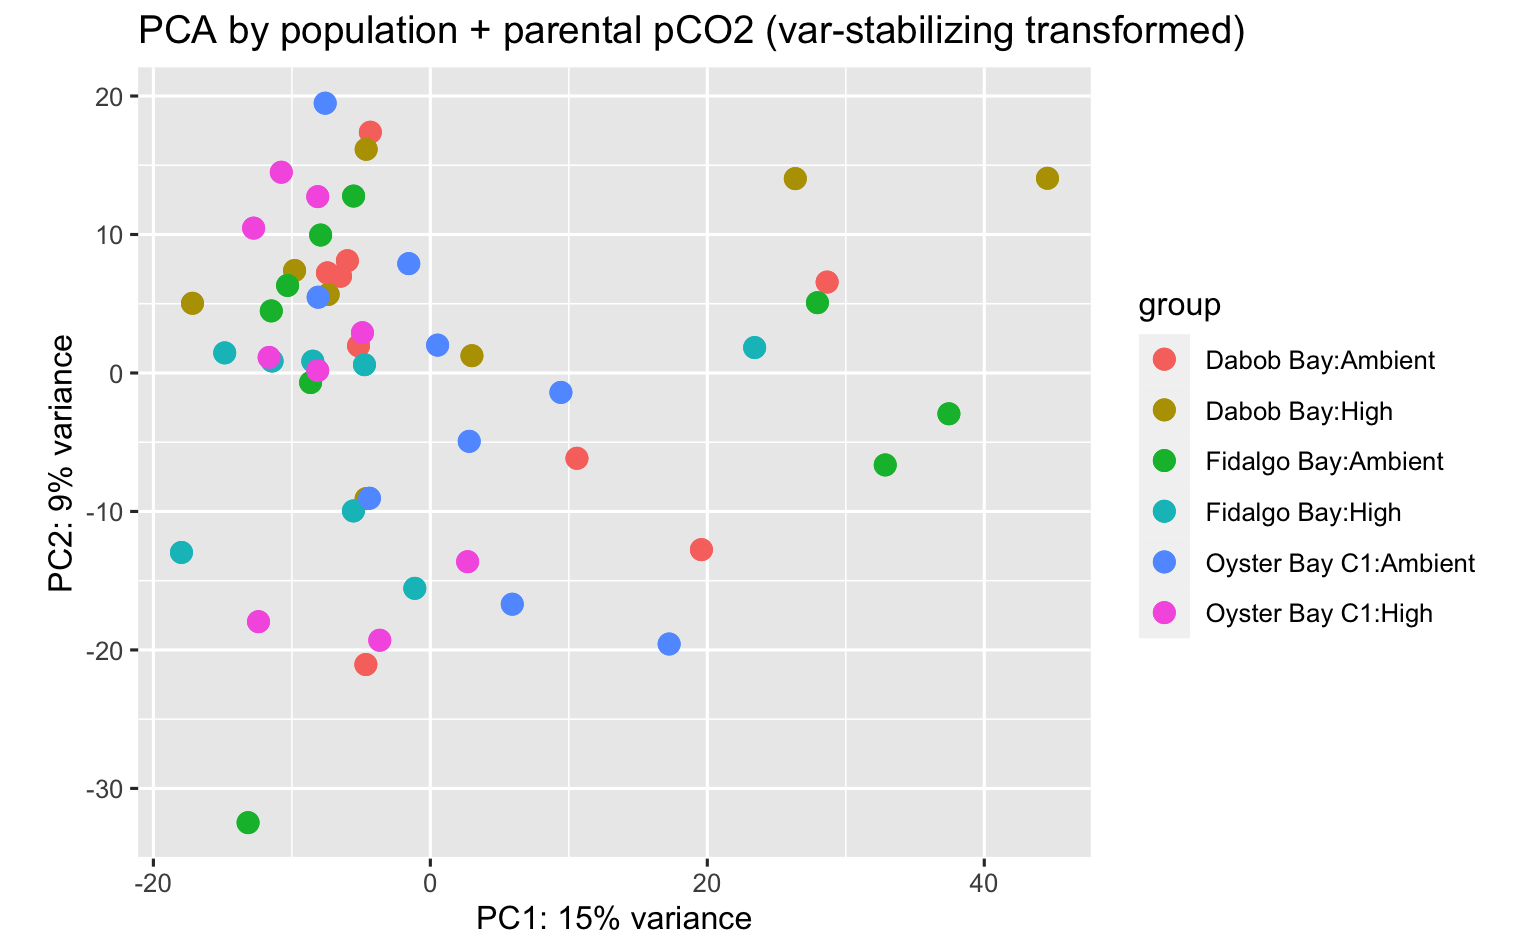
After a 7 week exposure to acidification (pH ~7.3) and ambient conditions (pH ~7.8), adults were sampled for ctenidia tissue. Here I analyze expression in ctenidia tissue by acidification exposure, and by population.
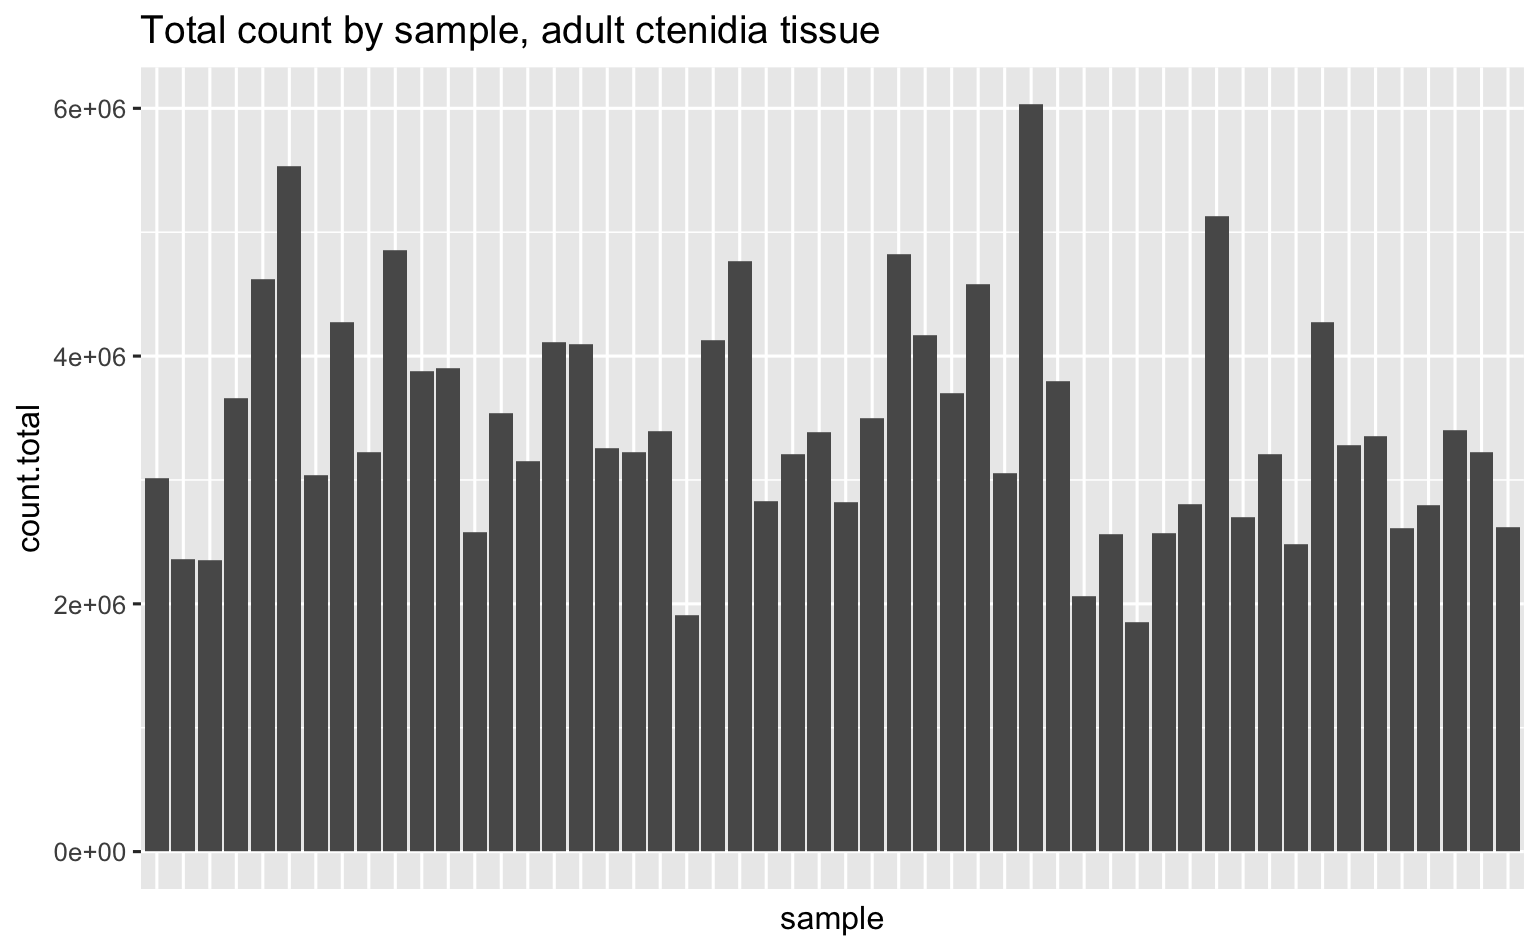
Total # reads - they all look pretty good.
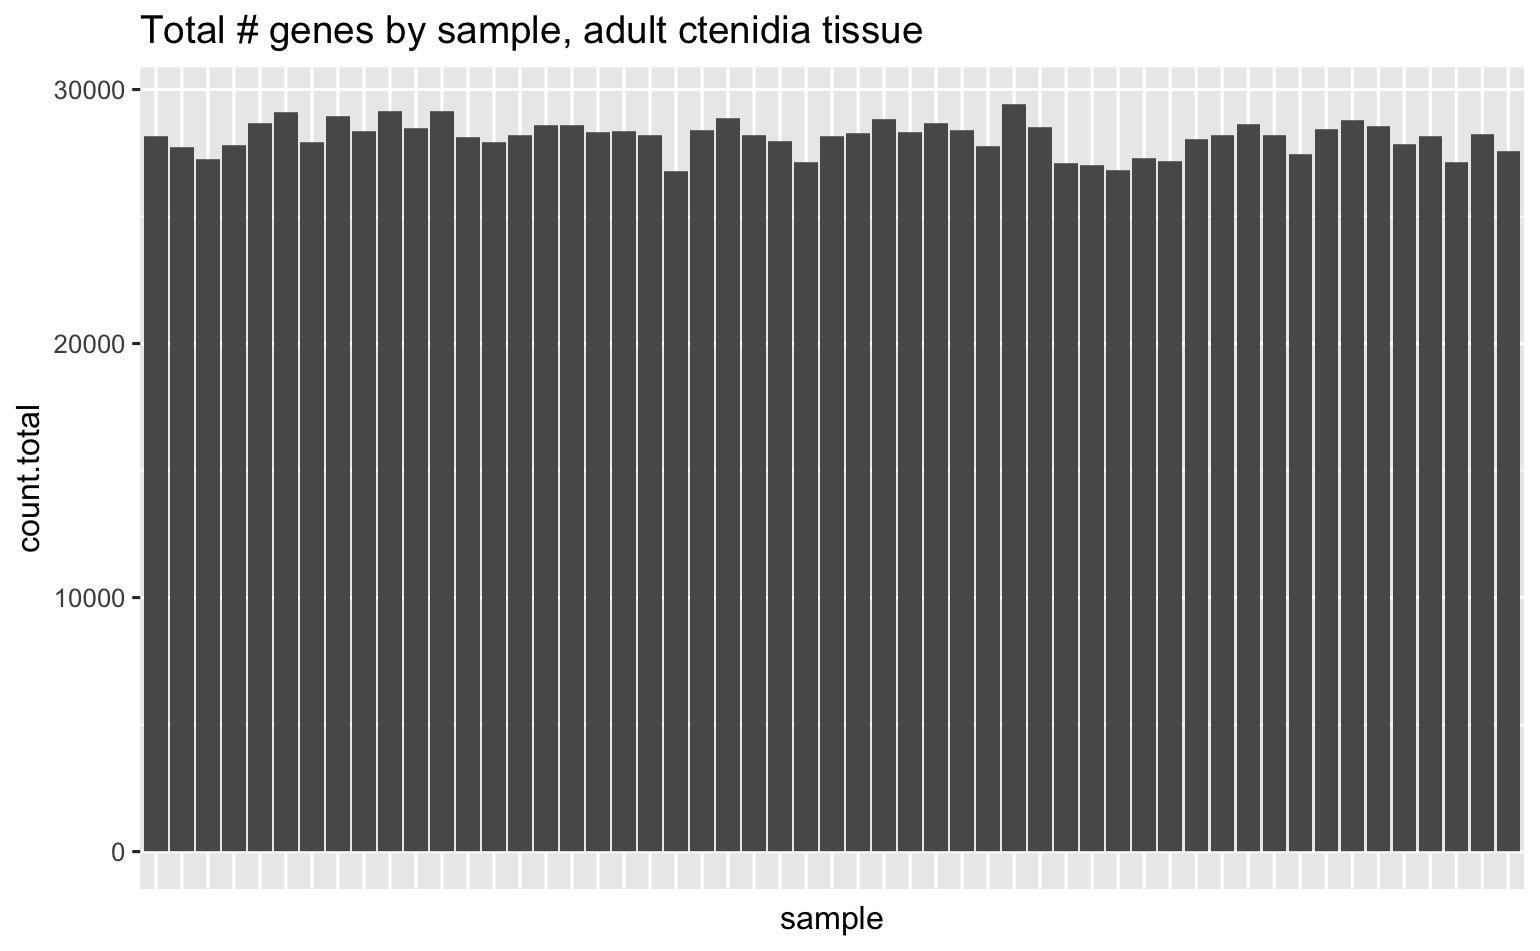
Total # of genes across all samples is 31,052, here’s how many unique genes were detected in each sample.
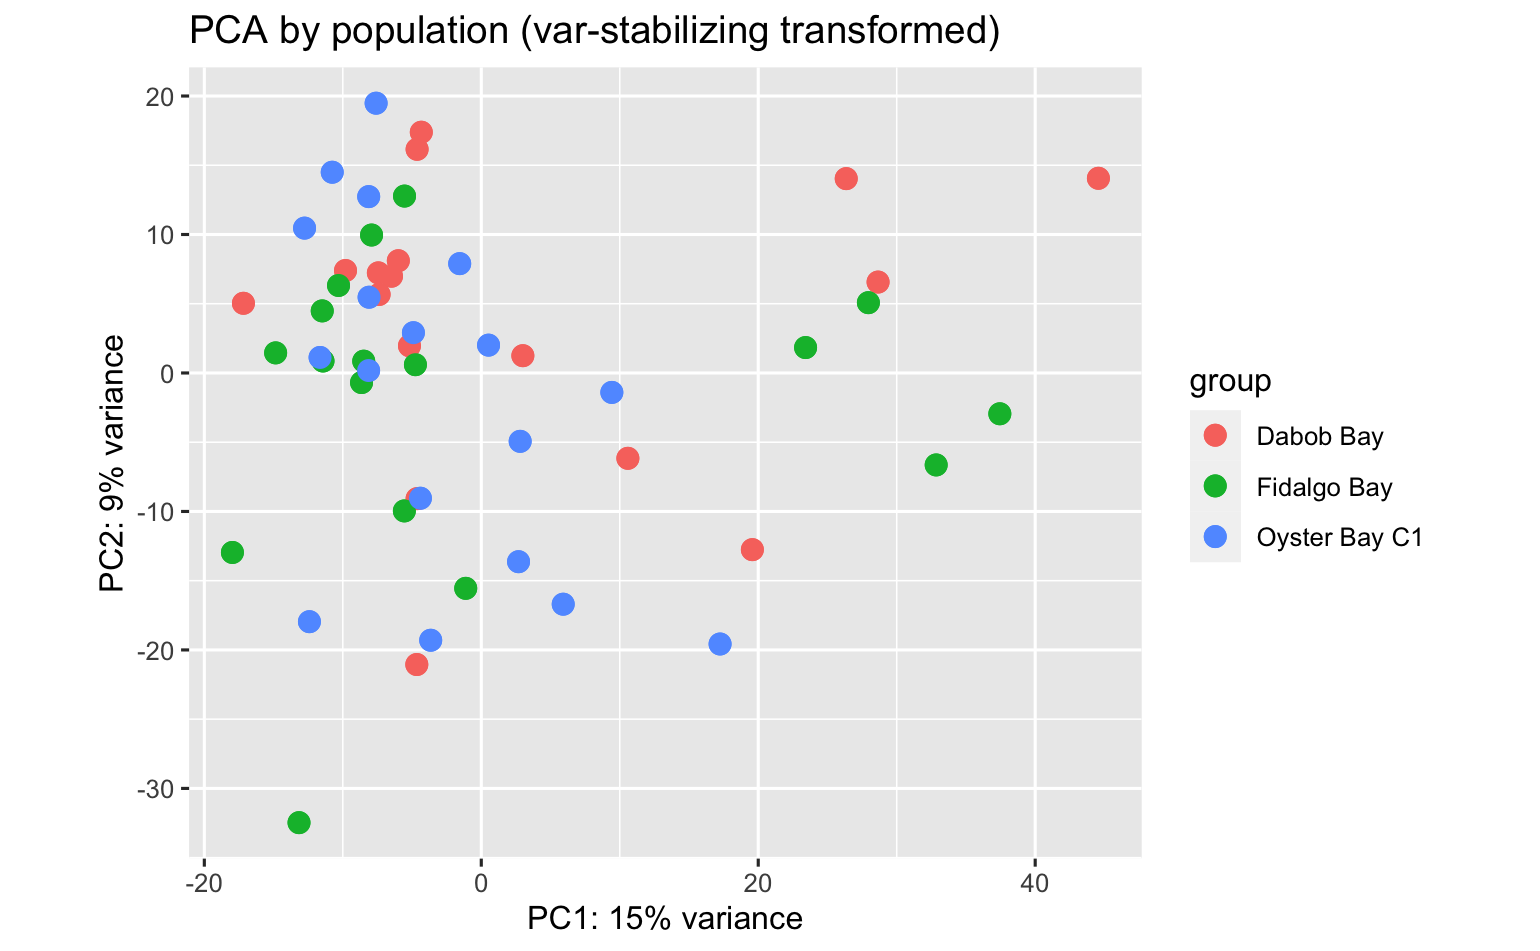
PCA’s using all data don’t indicate overwhelming expression differences among population, pCO2 exposure, or population:pCO2 exposure, but there are some DEGs.
- No. DEGs (padj<0.05) by pCO2, adult ctendia, comparison across all populations combined: 84
- No. DEGs by population, both pCO2 combined: did not assess (but I might)
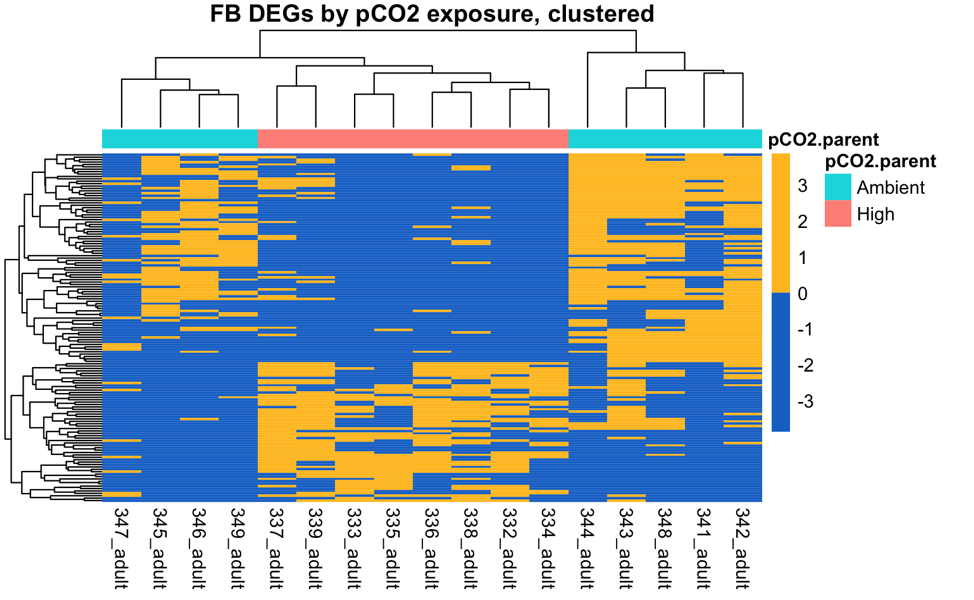
There were 145 DEGs between pCO2 exposure in the Fidalgo Bay adult ctenidia tissue.
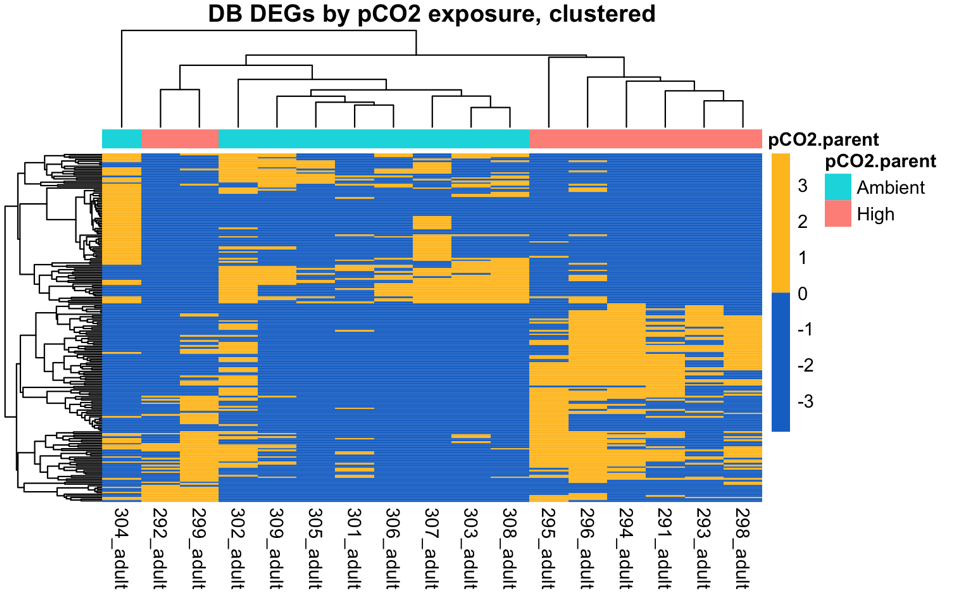
There were 207 DEGs between pCO2 exposure in the Dabob Bay adult ctenidia tissue.
There were no DEGs between pCO2 exposure in the Oyster Bay adult ctenidia tissue.
Larval differential expression analysis
I collected larvae within a day of release from the maternal brood chamber, then pooled them within each larval release pulse (likely all one family), and generated QuantSeq libraries from them.
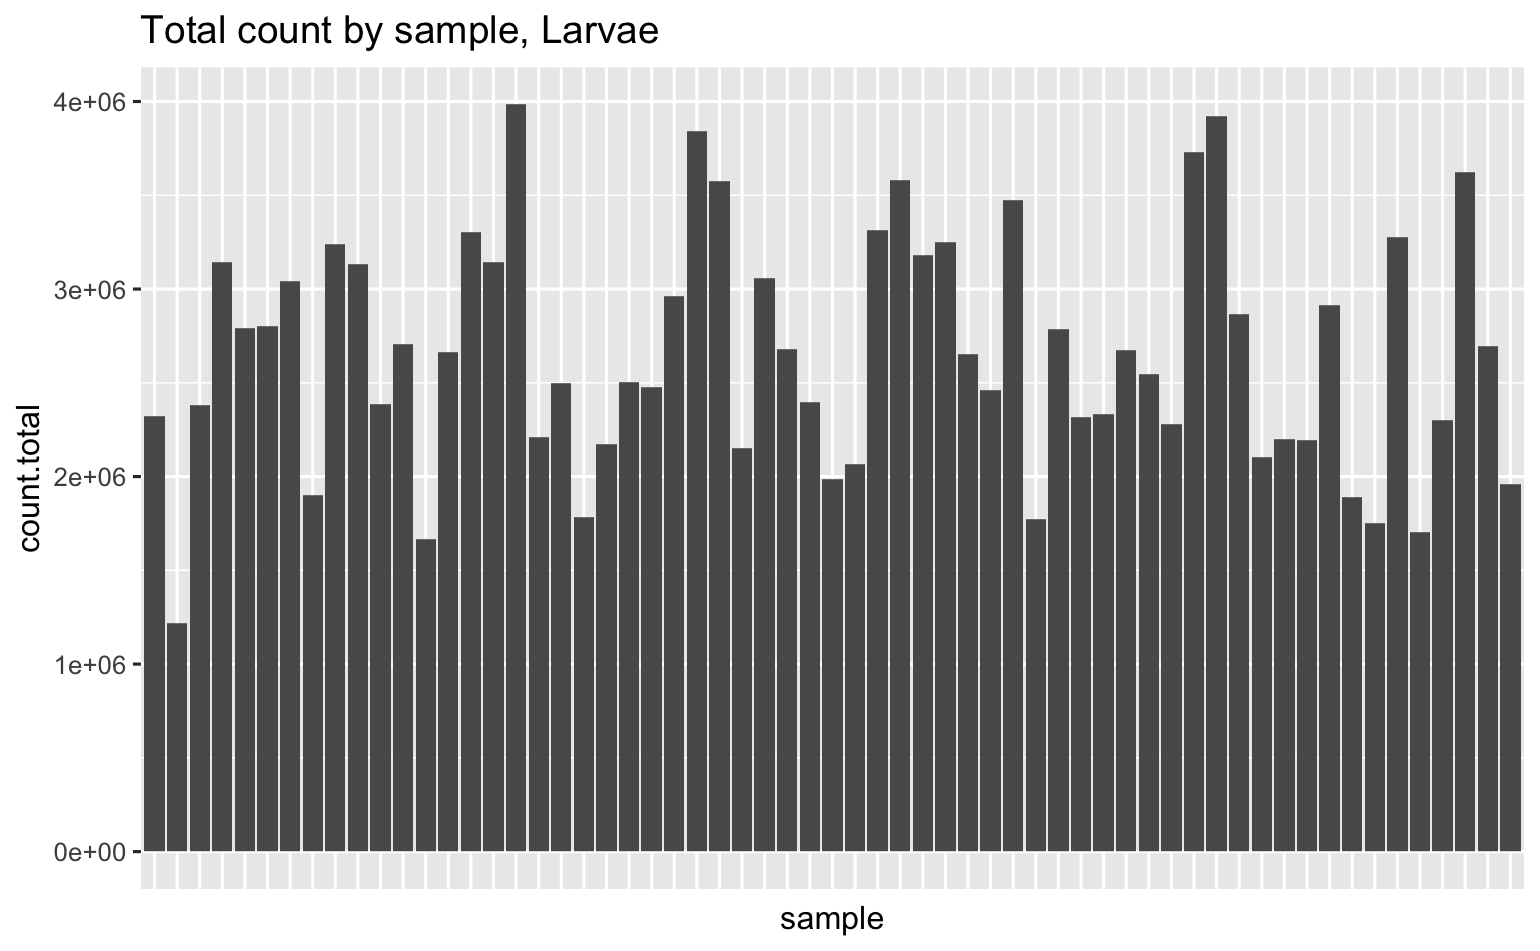
Total # reads
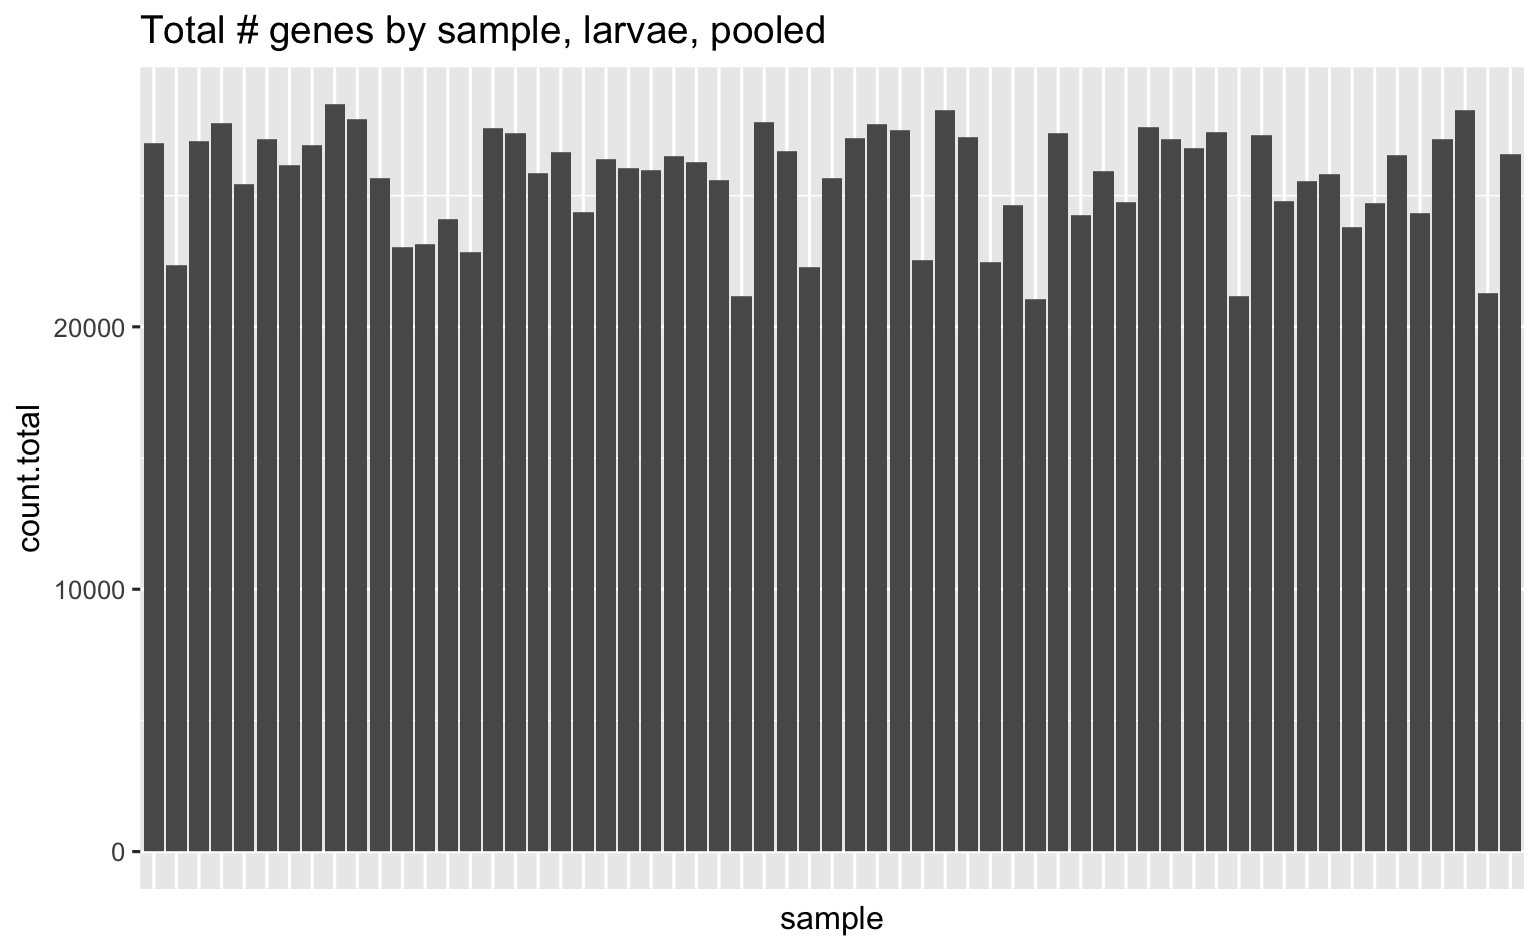
Total # of genes across all samples is 31,052, here’s how many unique genes were detected in each sample.
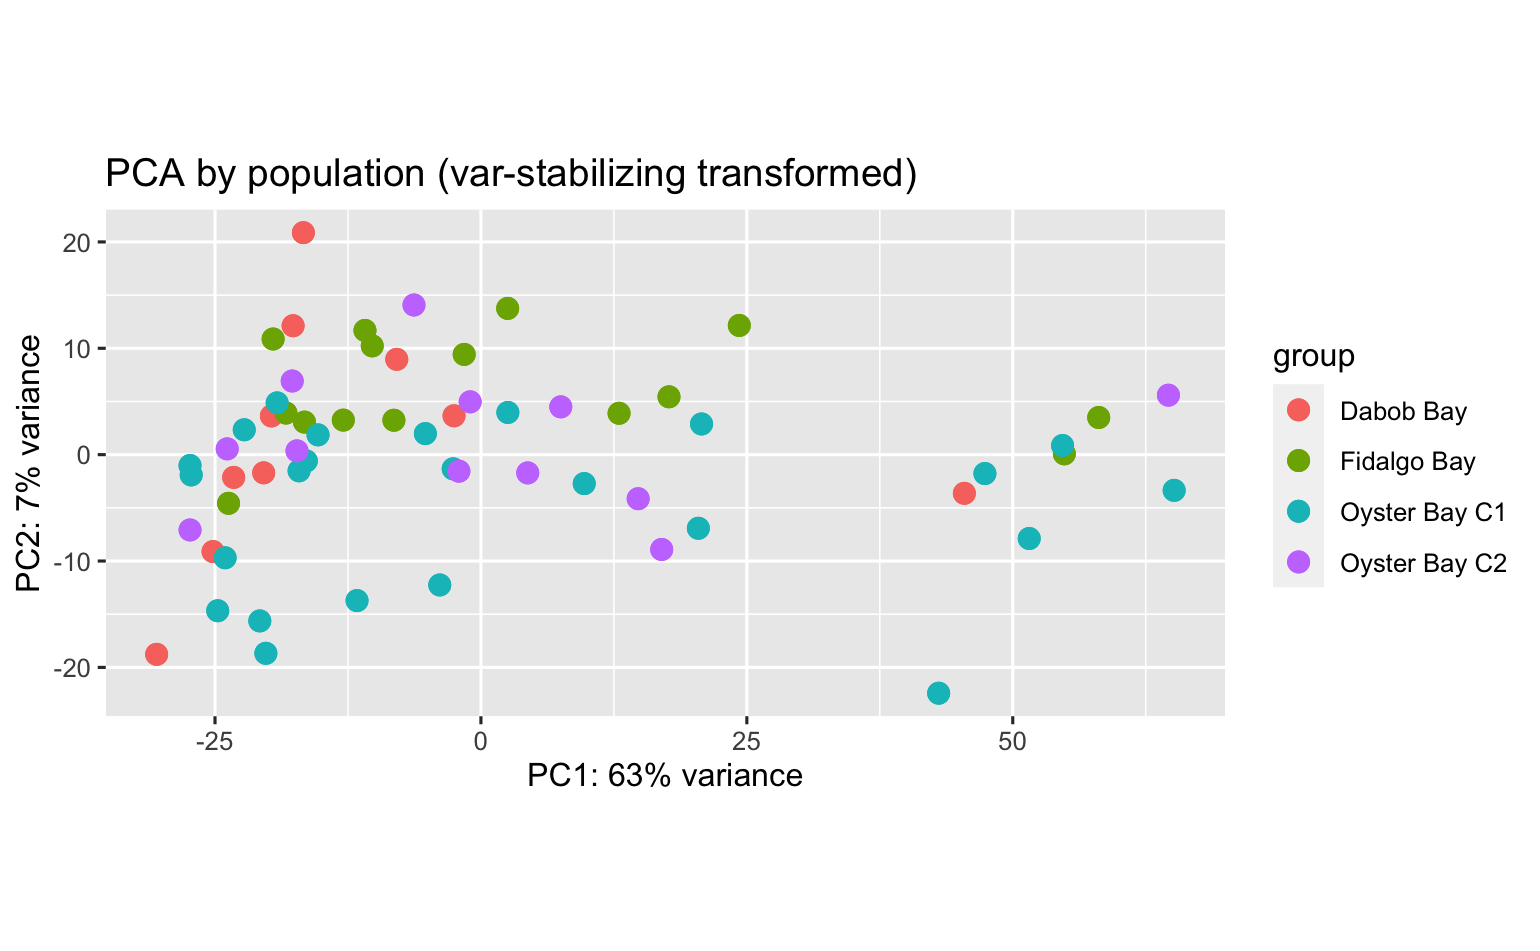
PCA’s using all data don’t indicate expression differences among pCO2 exposure or population:pCO2 exposure, but some differences among population.
There were no DEGs between parental pCO2 using all populations combined.
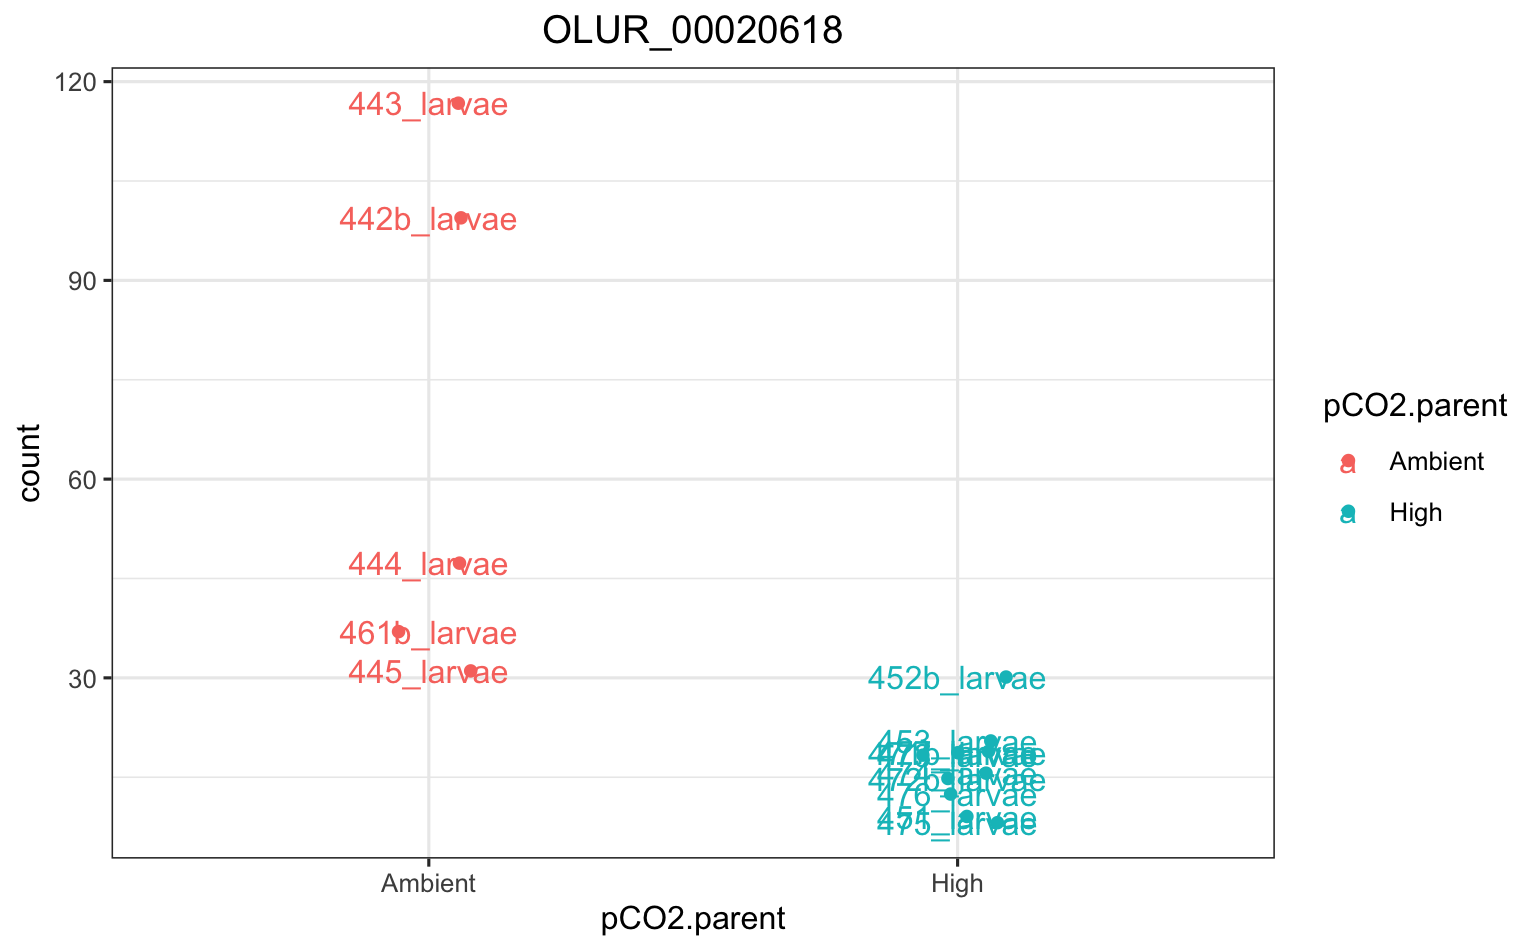
There was only 1 DEG among parental pCO2 exposure within populations - it was in Fidalgo Bay, and codes for an unknown protein.
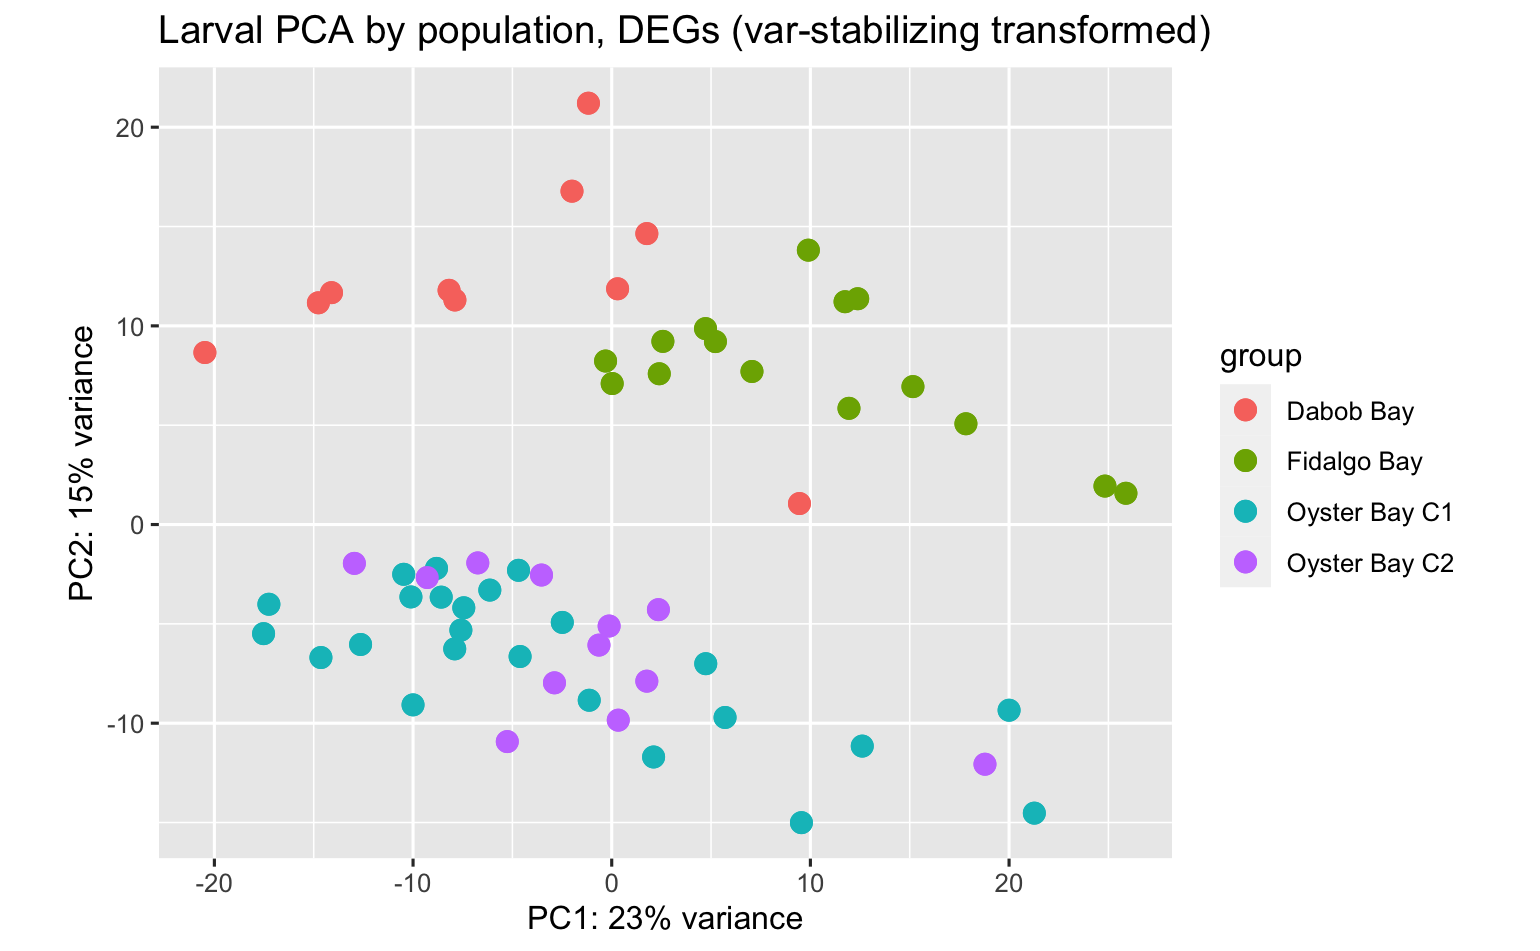
There were quite a few DEGs among populations (each population compared against all others). Here’s the PCA using all data.
- DEGs between Dabob & Fidalgo larvae: 315
- DEGs between Dabob & Oyster Bay C1 larvae: 268
- DEGs between Dabob & Oyster Bay C2 larvae: 163
- DEGs between Fidalgo & Oyster Bay C1 larvae: 661
- DEGs between Fidalgo & Oyster Bay C2 larvae: 254
- DEGs between Oyster Bay C1 & C2 larvae: 0 <– This is pretty interesting! Oyster Bay C1 and C2 are related (they are F1 and F2 of the same pop), and there are NO DEGs, in comparison there are hundreds of DEGs among the other populations. This indicates a strong genetic influence on larval physiology.
Here’s a PCA using only genes that were identified as DEGs between at least one population comparison.
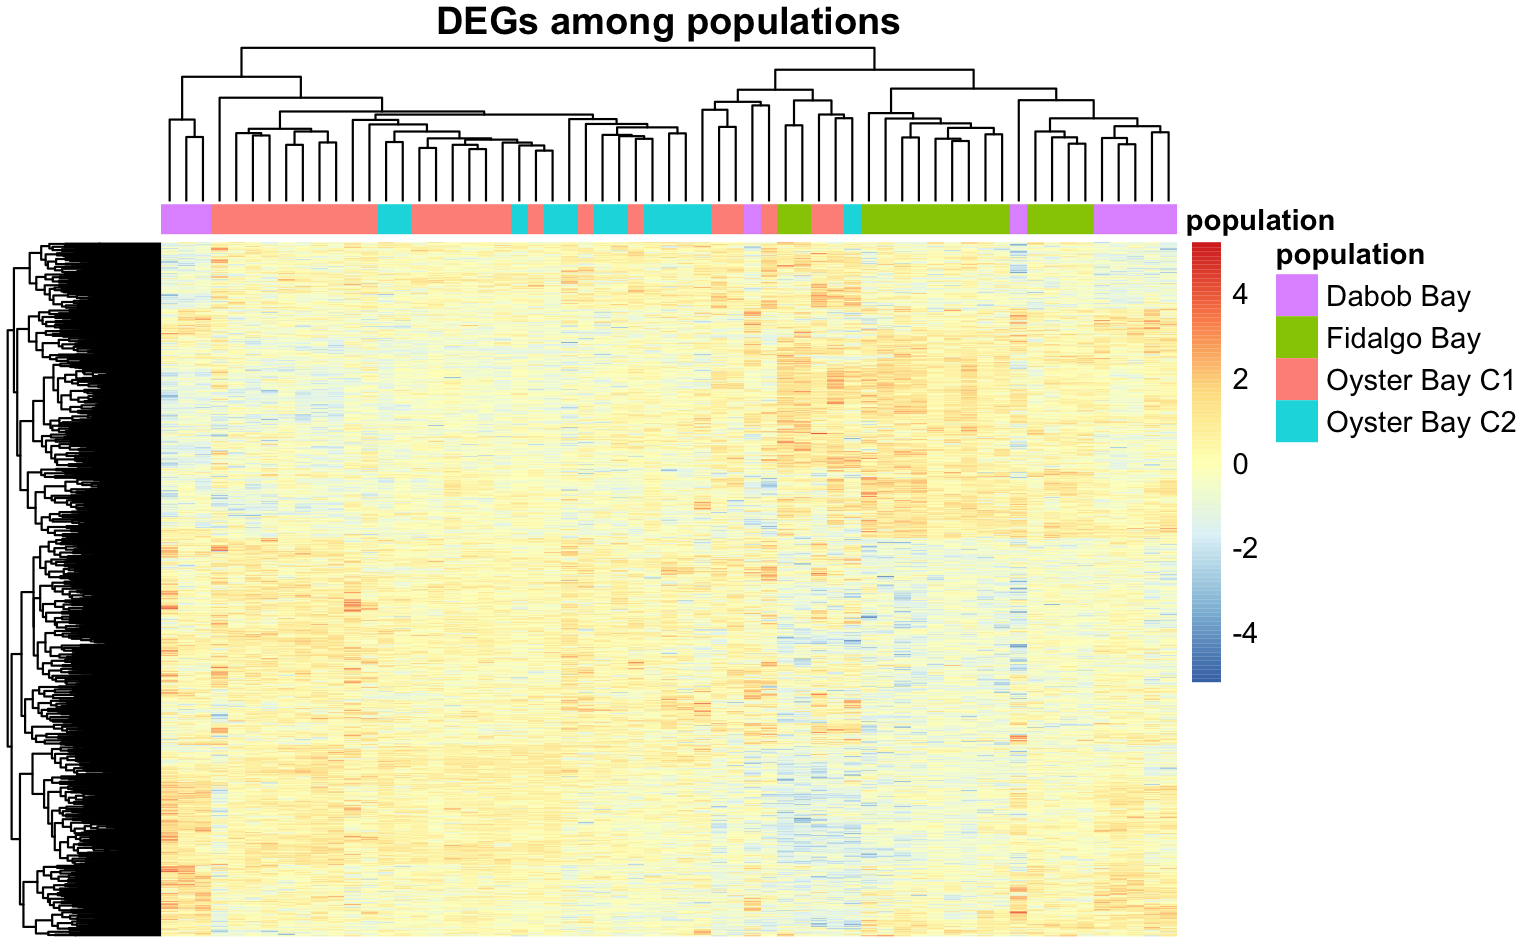
And a heatmap using only genes that were identifed as DEGs in at least one pop-pop comparison.
Juvenile differential expression analysis
The larvae that I collected were reared within parental treatment groups, then grown for 1 year at the Manchester dock, and then tested in the field for 3 monts across multiple sites. For this gene expression analysis, I used 2 populations (DB and FB) from the Port Gamble Bay site, since I saw differential survival there among parental pCO2 treatments. Whole-body tissue was frozen, then homogenized. I call these juveniles, but since they were ~15 months old, they could have had some gonad development- that’s something to keep an eye out for in the expression data.
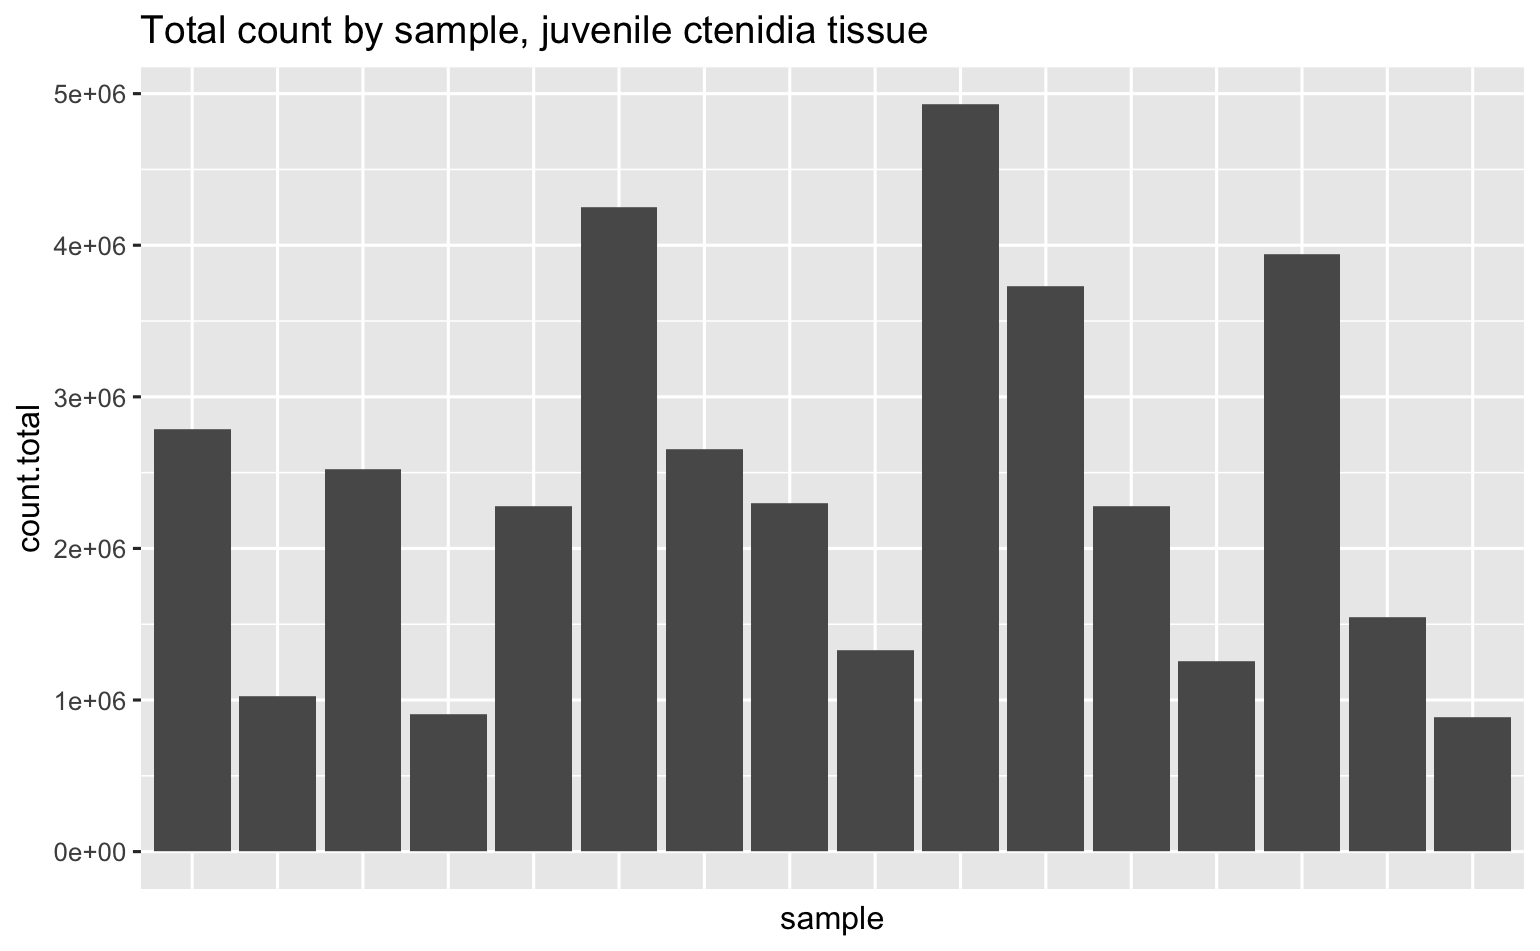
Total # reads, could be better.
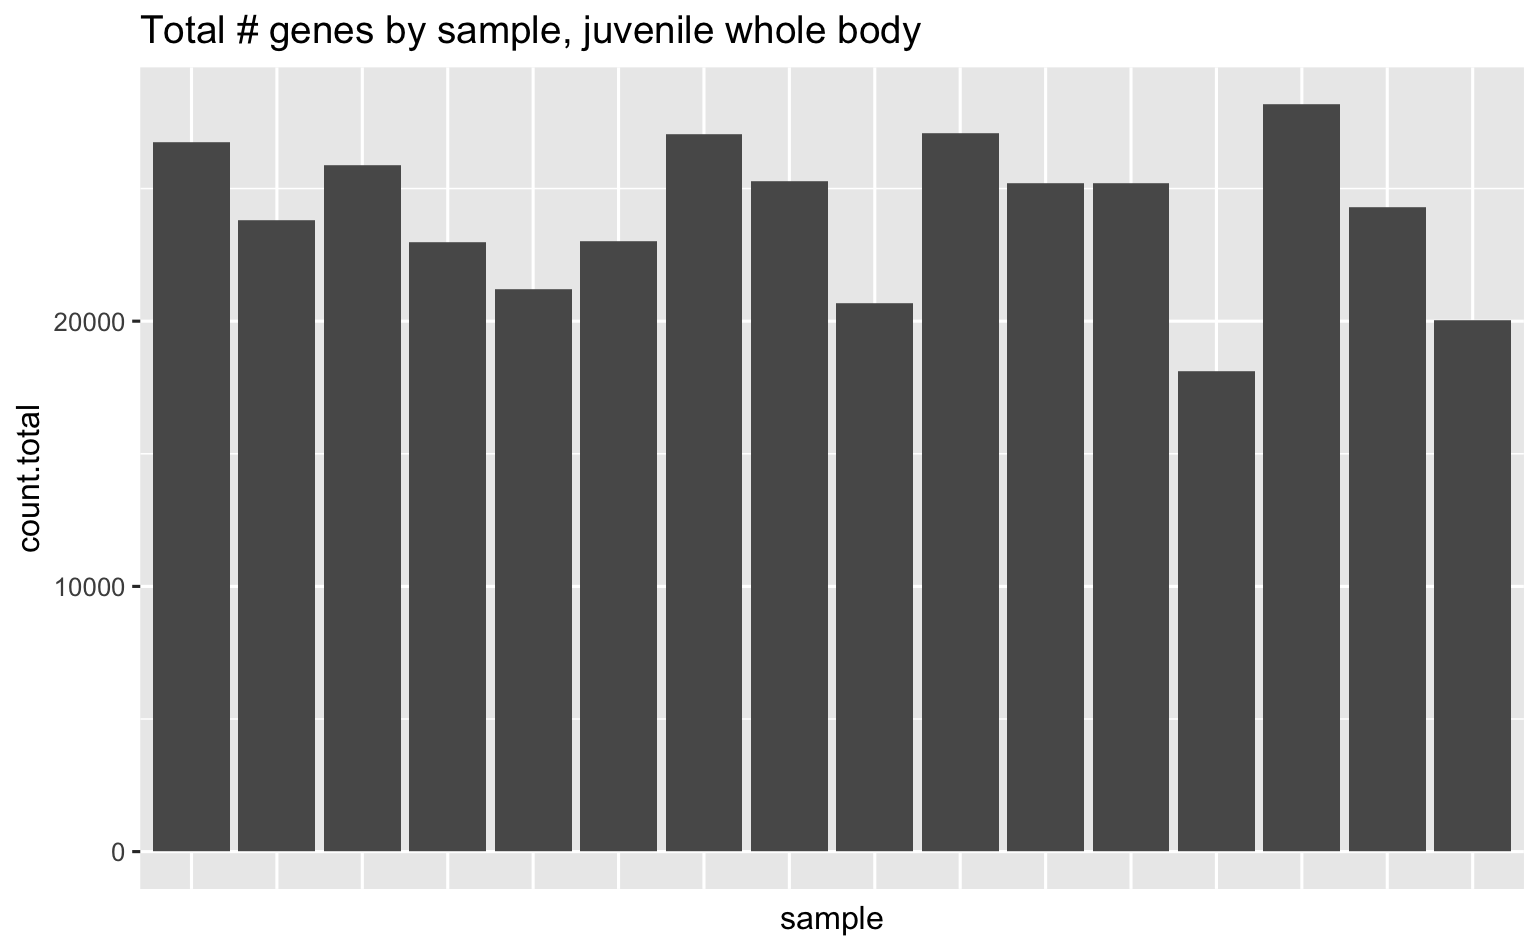
Total # of genes across all samples is 31,052, here’s how many unique genes were detected in each sample.
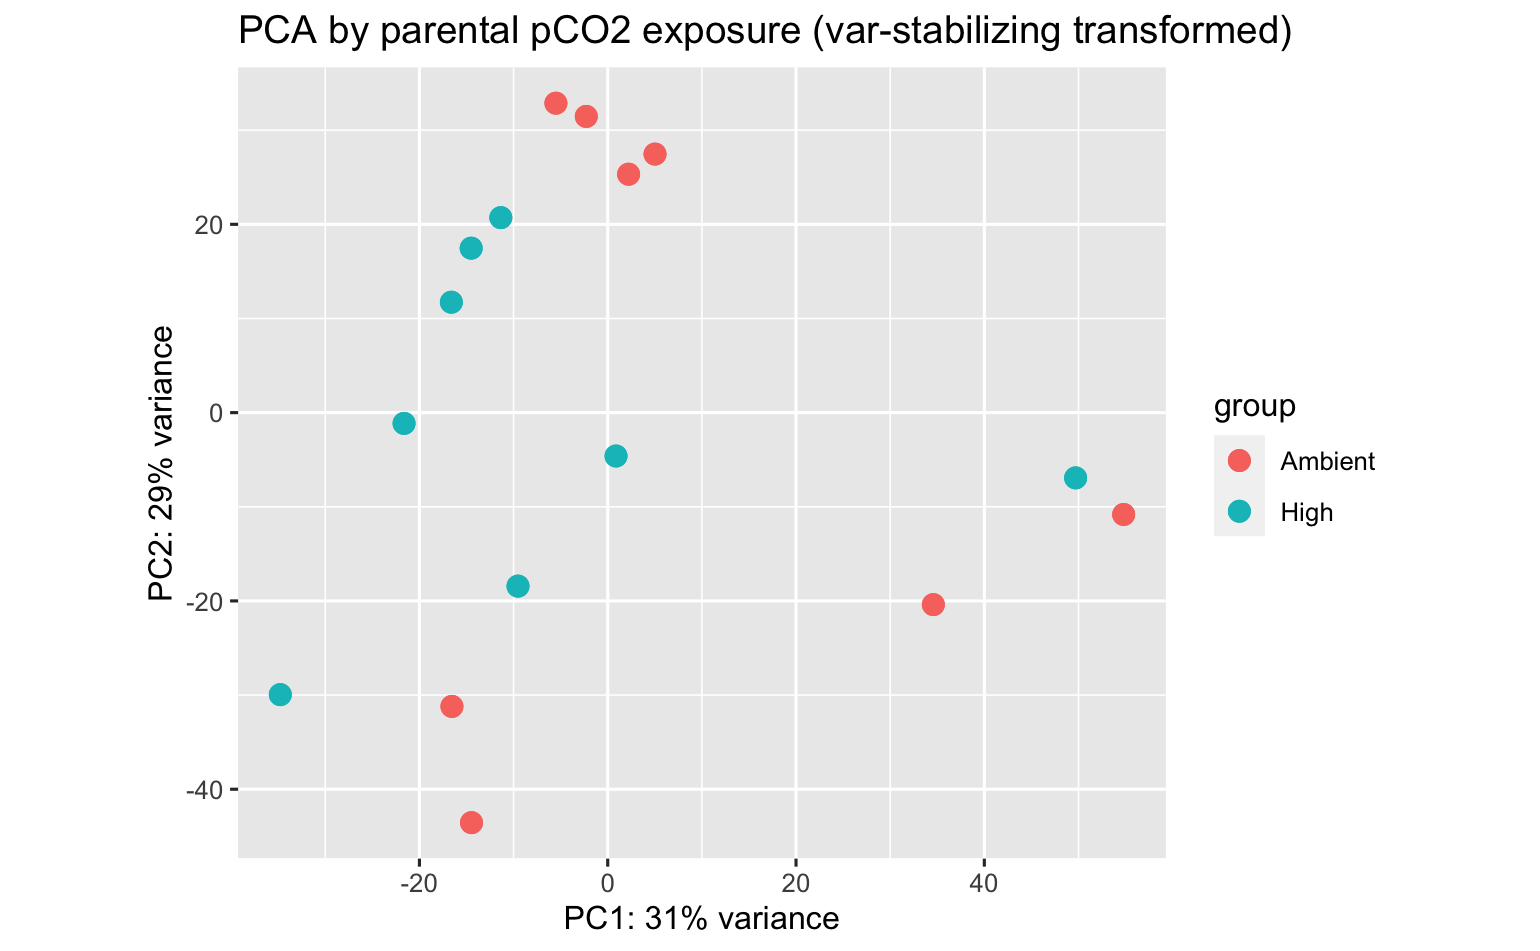
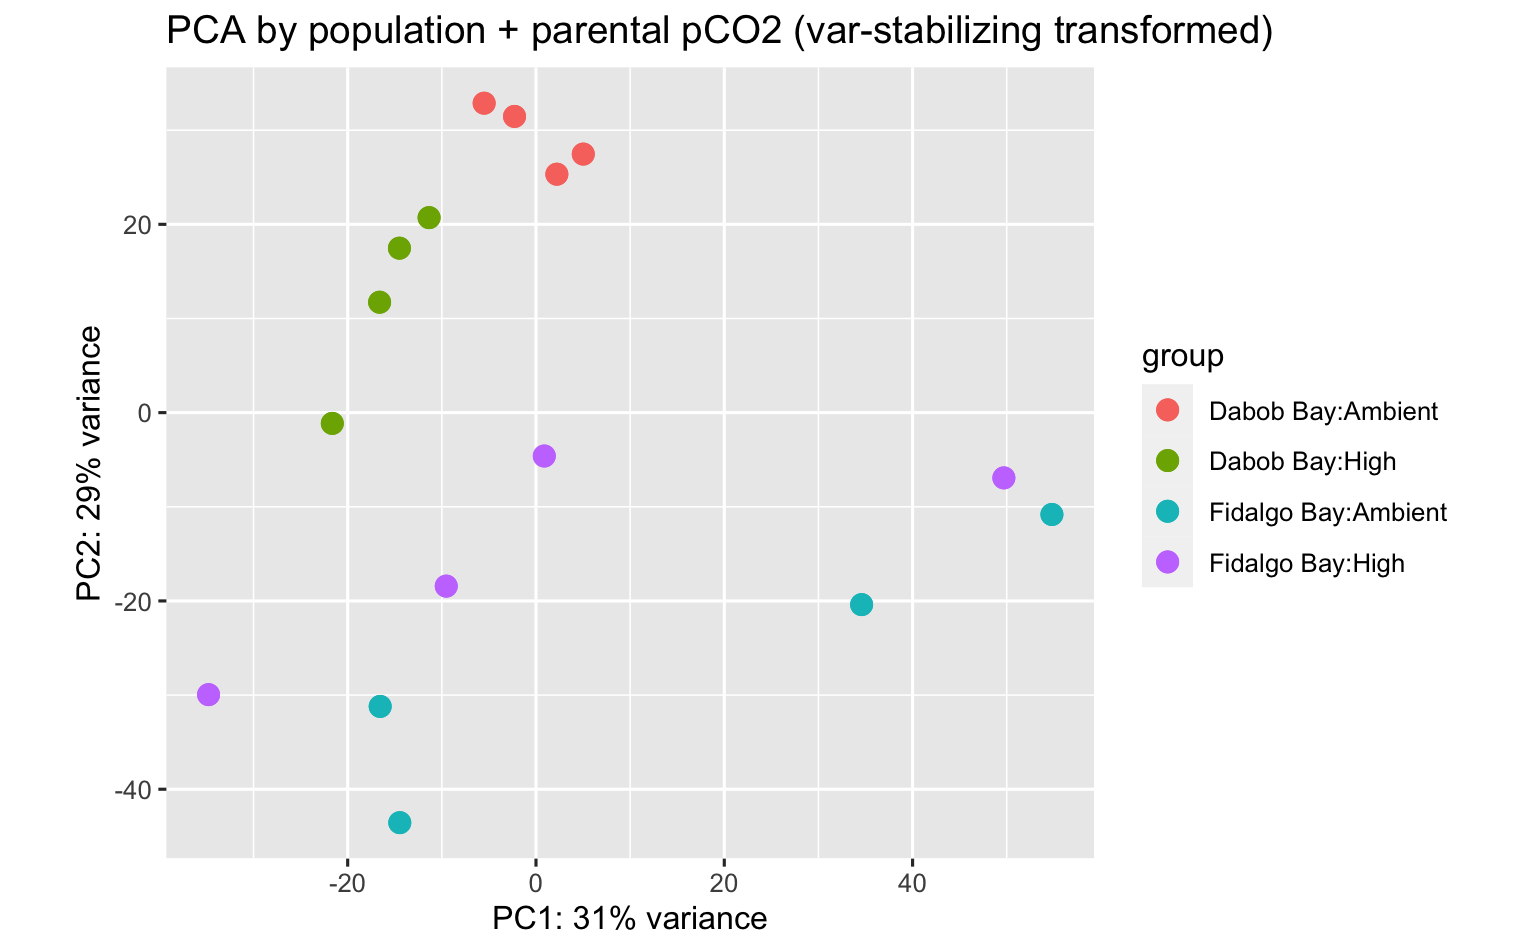
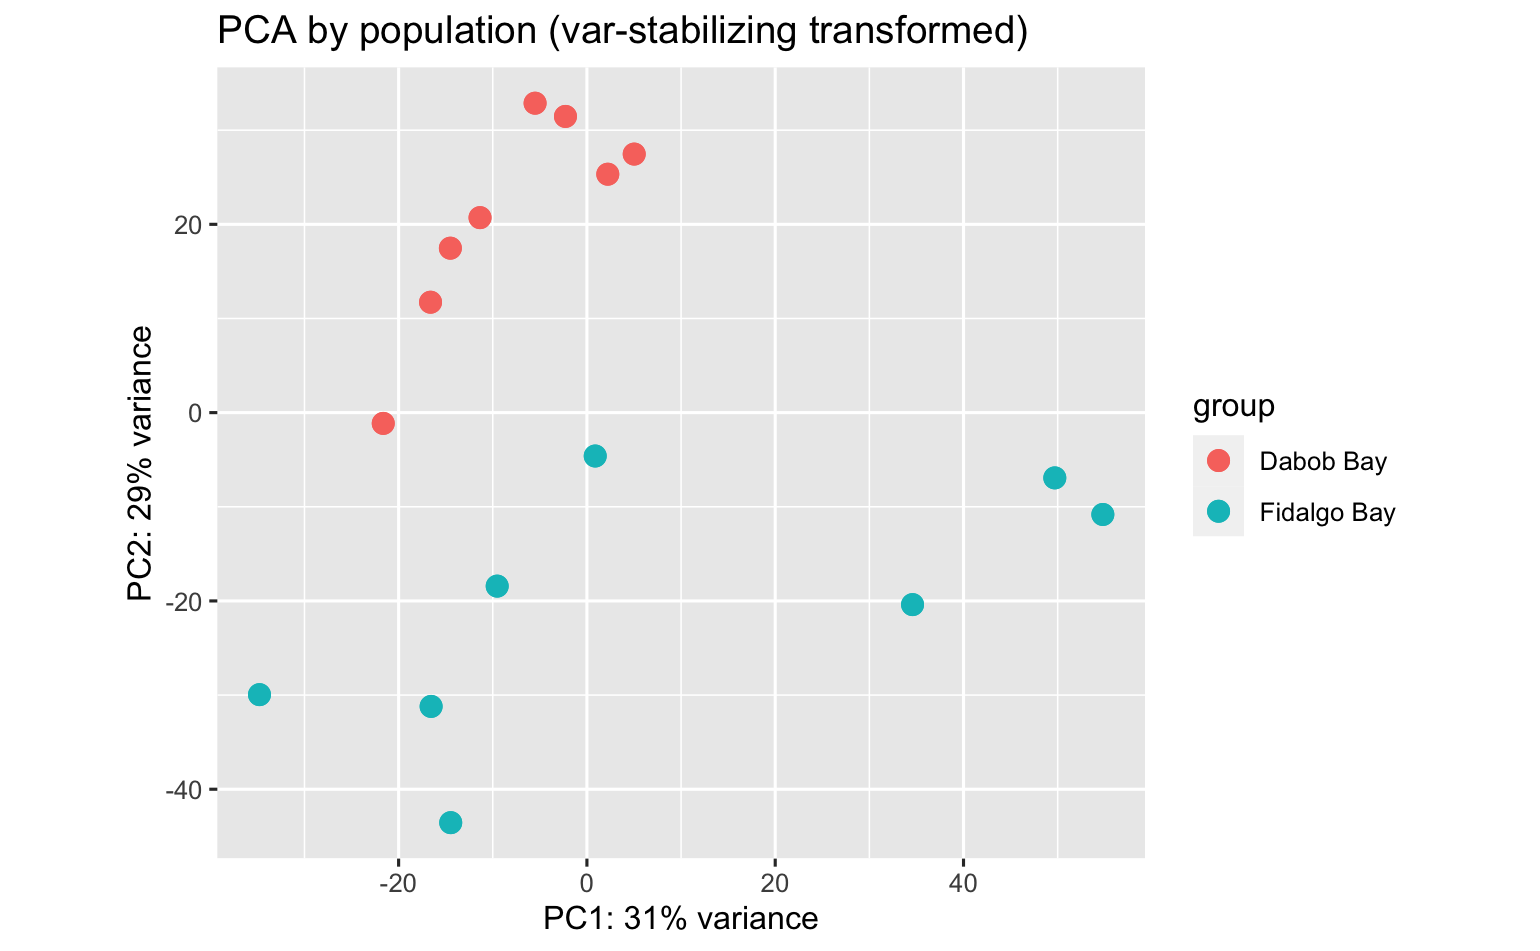
PCA’s using all data surpisingly show strong patterns among parental population, pCO2 exposure, and population:pCO2 exposure!
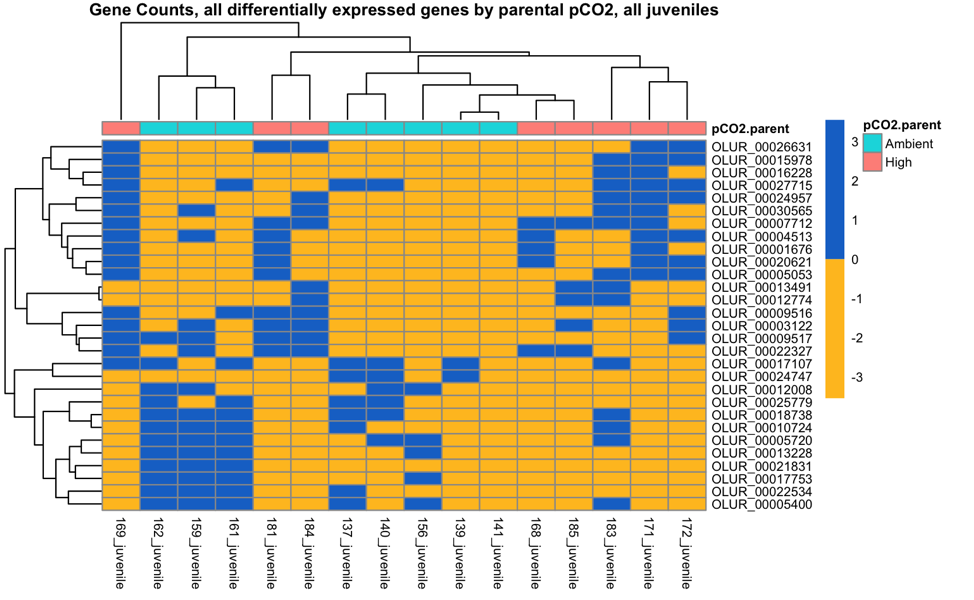
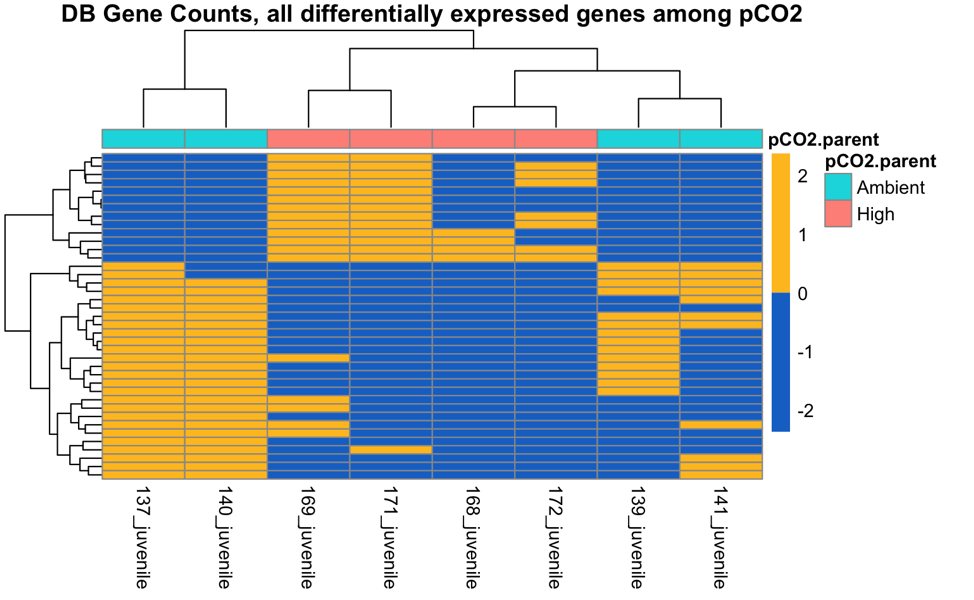
There are 29 DEGs between parental pCO2 exposure, both populations combined.
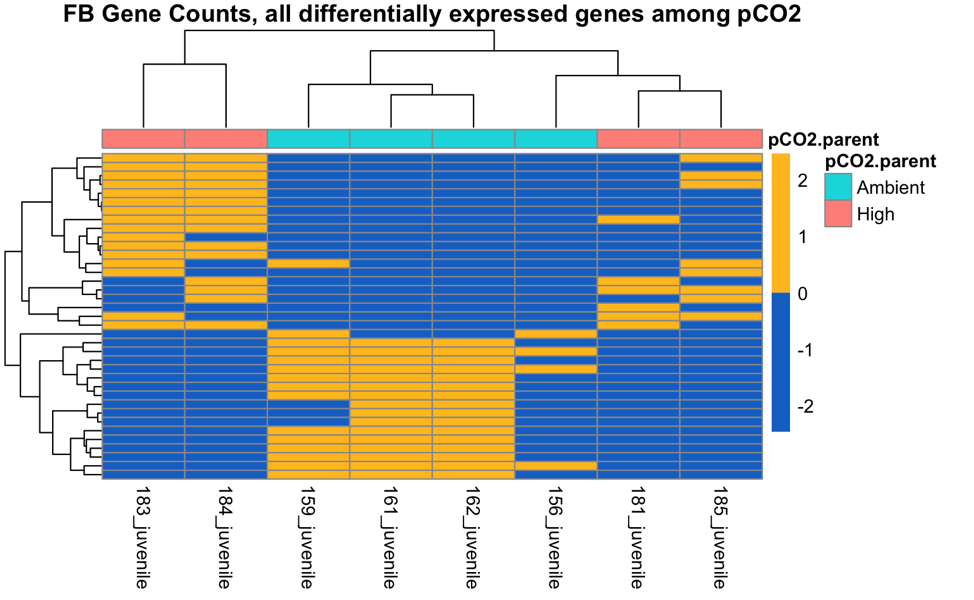
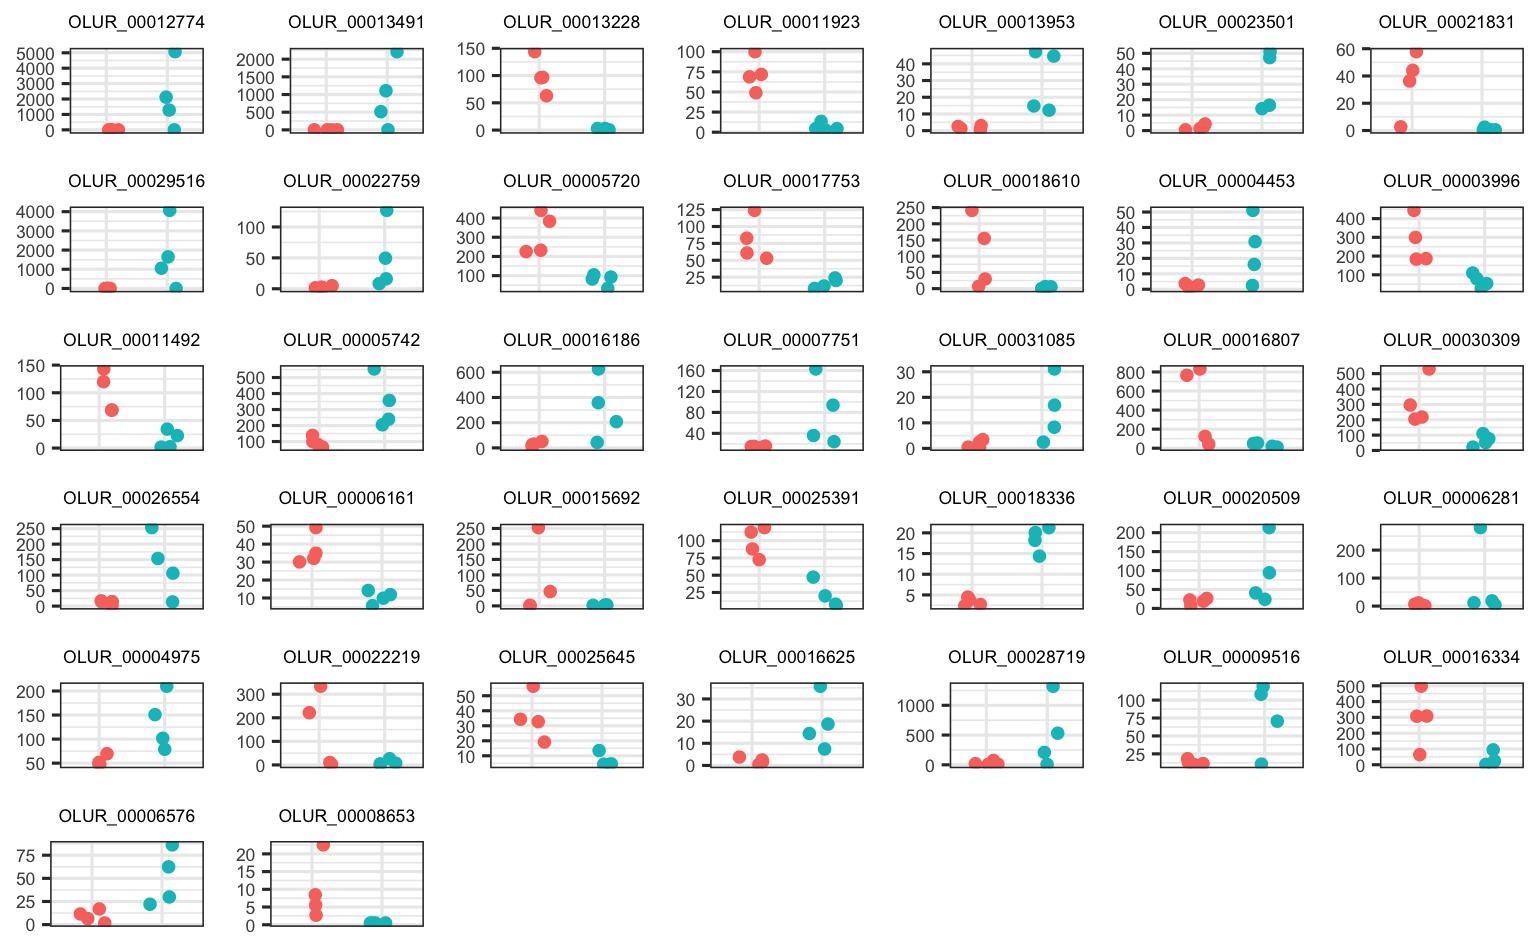
There are 37 and 39 DEGs among parental pCO2 exposure in the Fidalgo Bay and Dabob Bay populations, respectively.
These are the 37 parental pCO2 DEGs in Fidalgo Bay juveniles
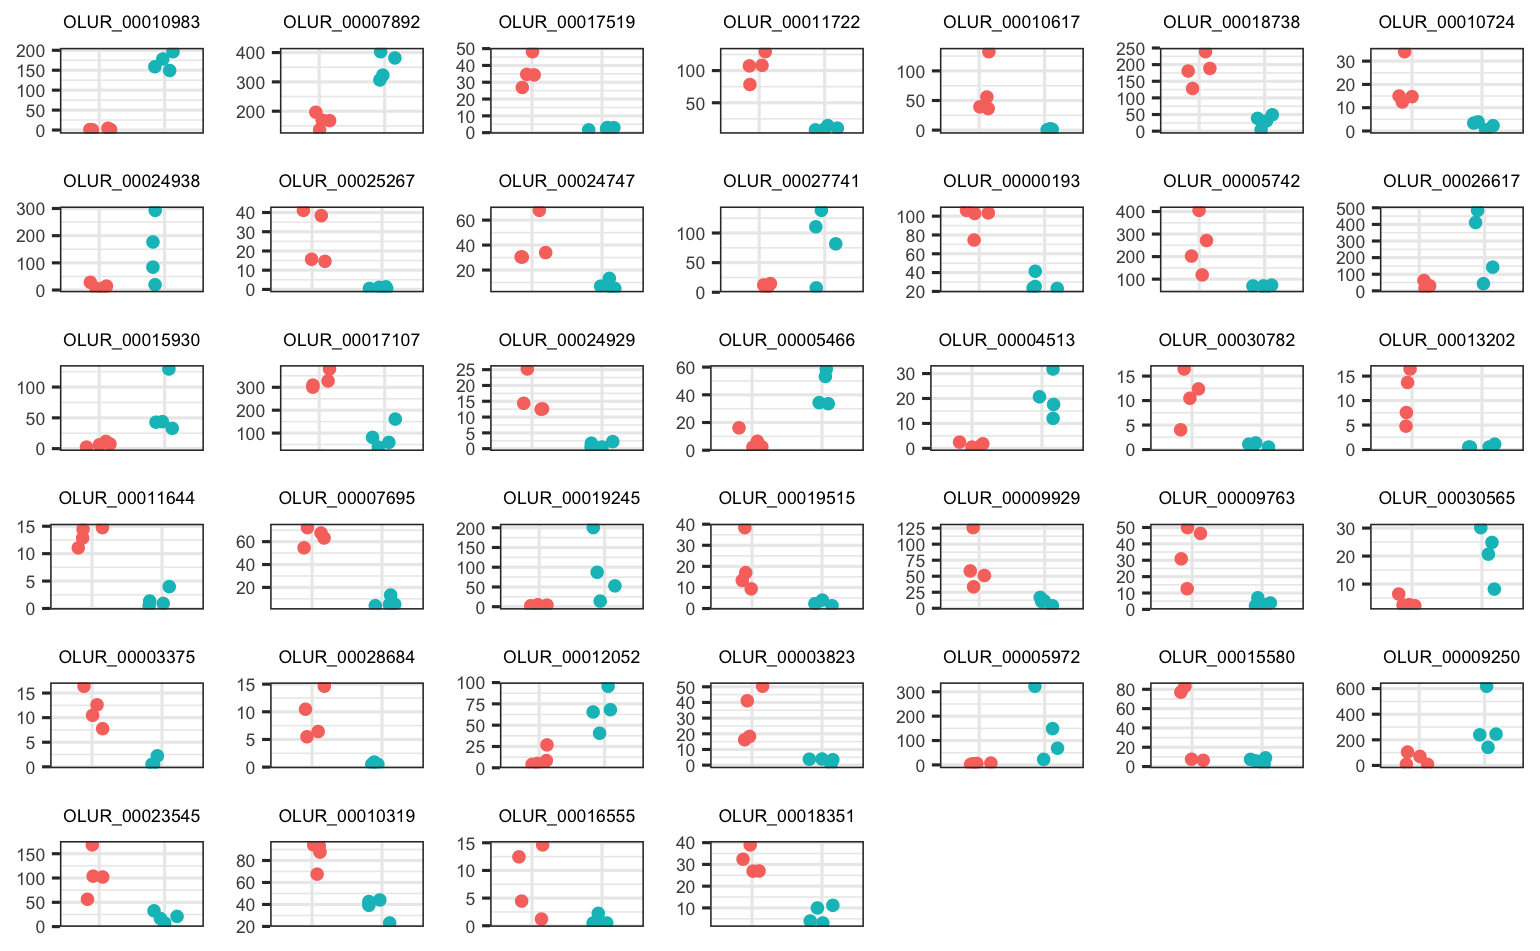
These are the 39 parental pCO2 DEGs in Dabob Bay juveniles (somewhat less convincing)
I didn’t do DEA between juvenile pops w/o considering pCO2, but here is the PCA anyway.
Conclusion
I see surprisingly moderate effect of direct exposure to acute acidification (pH 7.3) on adult ctenidia tissue - 145 & 207 DEGs in 2 populations, but not strong clustering in the PCA. There is virtually no signal of parental exposure to acidification in the newly released larvae (only 1 DEG in the FB population), BUT I do see strong expression differences among population (FB, DB, OB), but no differences among the two generations of the OB population, which indicate that there is a strong genetic influence on the physiologies of newly released veliger larvae. In juveniles I see surprisingly clear/distinct differences among parental pCO2 within population, and across both populations (see PCAs), and found a few dozen DEGs between parental pCO2 exposure in the two populations that I examined (FB and DB). However, the next major step is to genotype the juveniles to determine their relatedness, before I can argue that the observed expression differences are conclusively due to intergenerational carryover effects.