Initial survival data, Olympia oyster experiment 2017
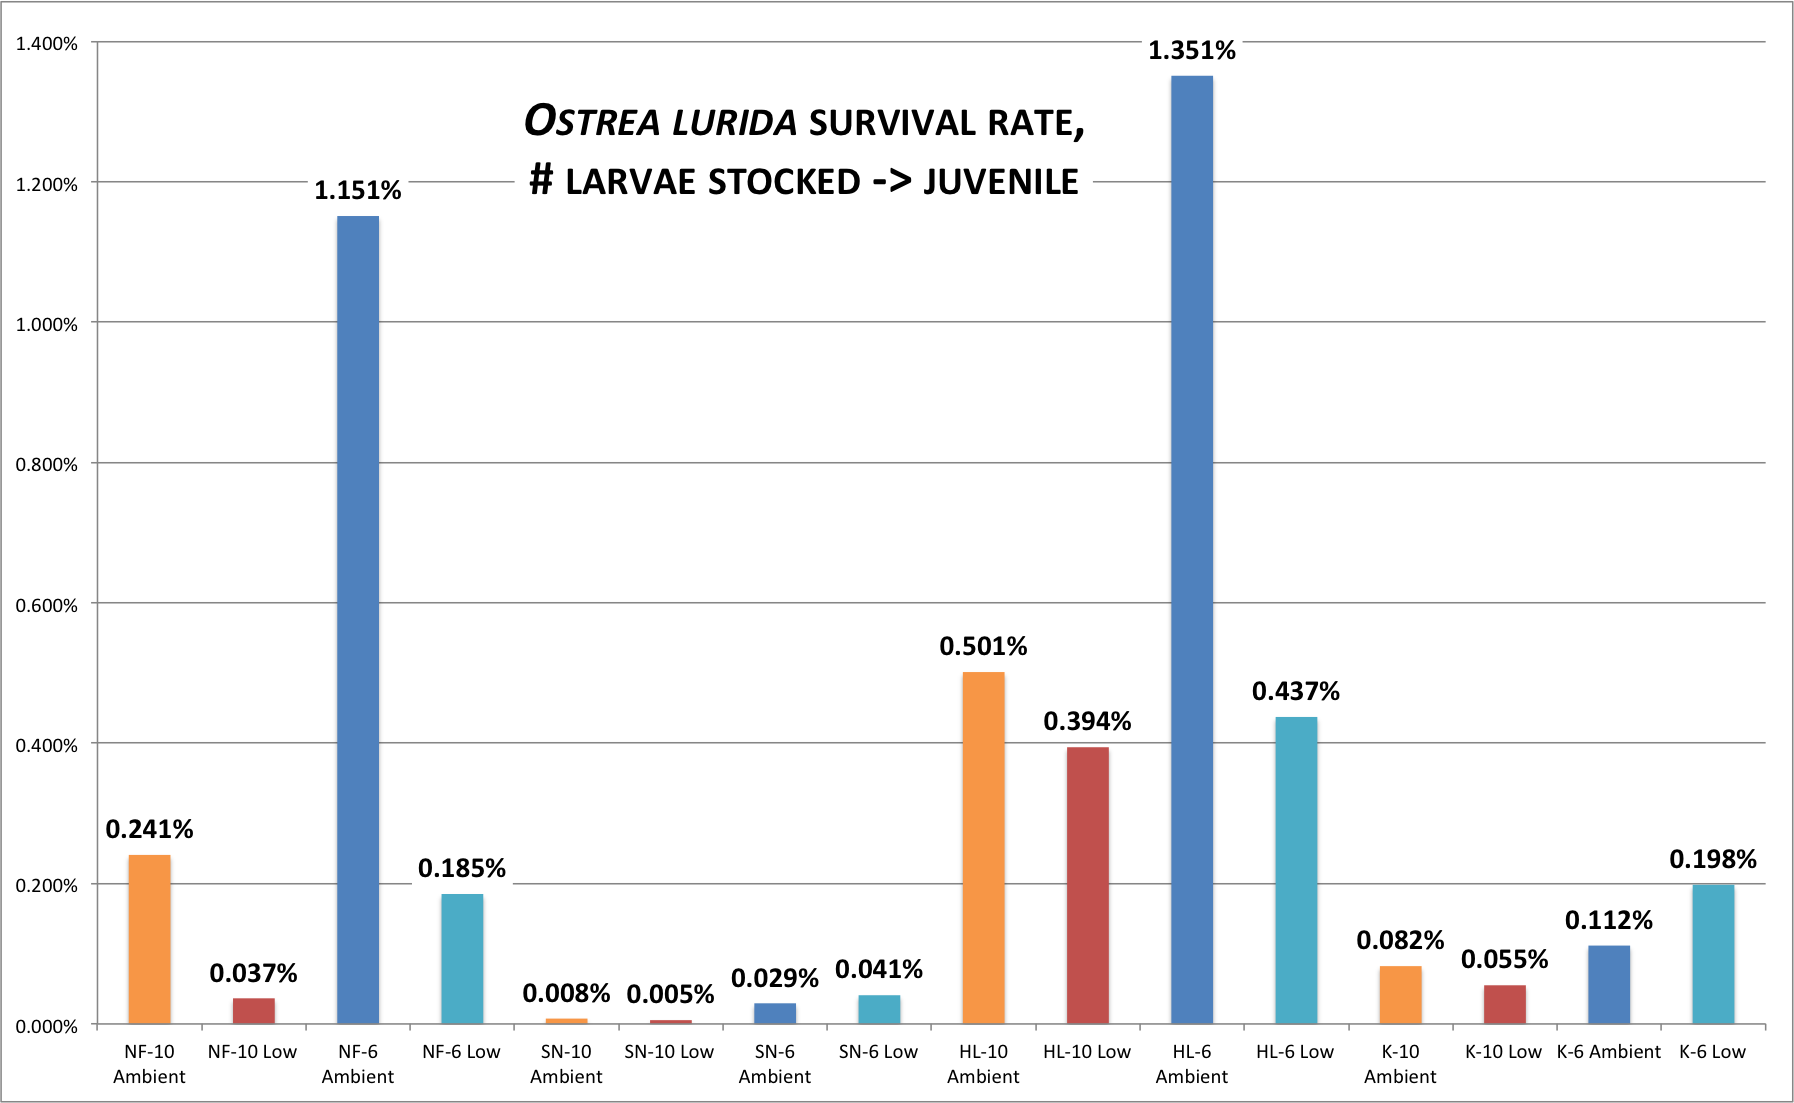
The following is data on Oly survival from larvae to juvenile. Data is adjusted for a few events where larvae were lost due to overflowed bucket, etc. Data was adjusted by calculating the mean % larvae accounted for from one bucket count to the next (pretty good, 94%), then taking the difference between the actual # counted during screening after loss event and what would be predicted by the 94% accountability rate.
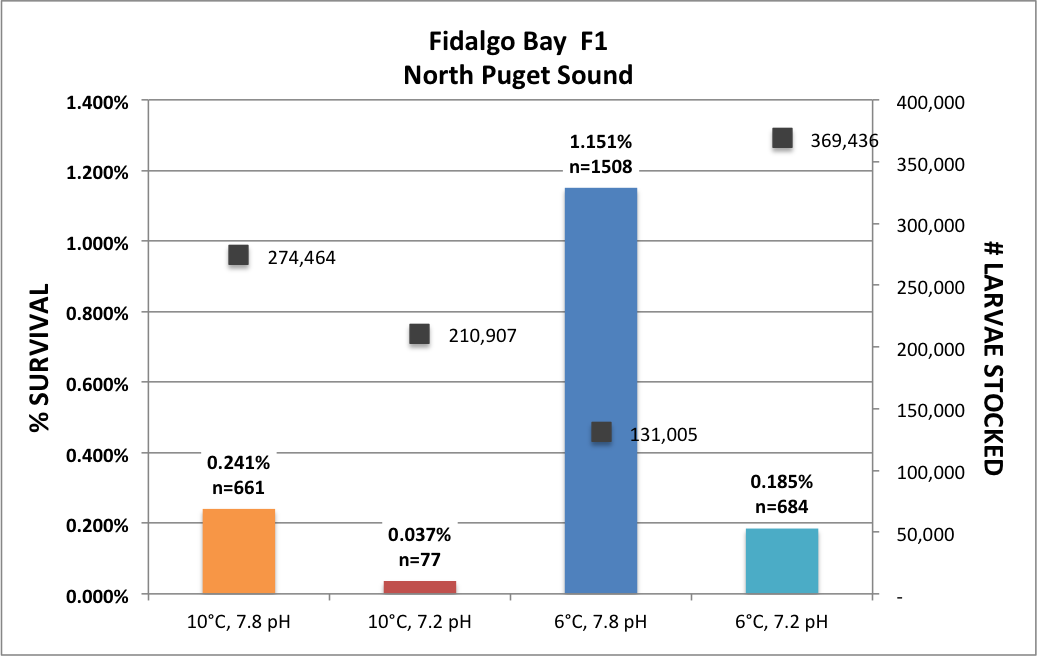
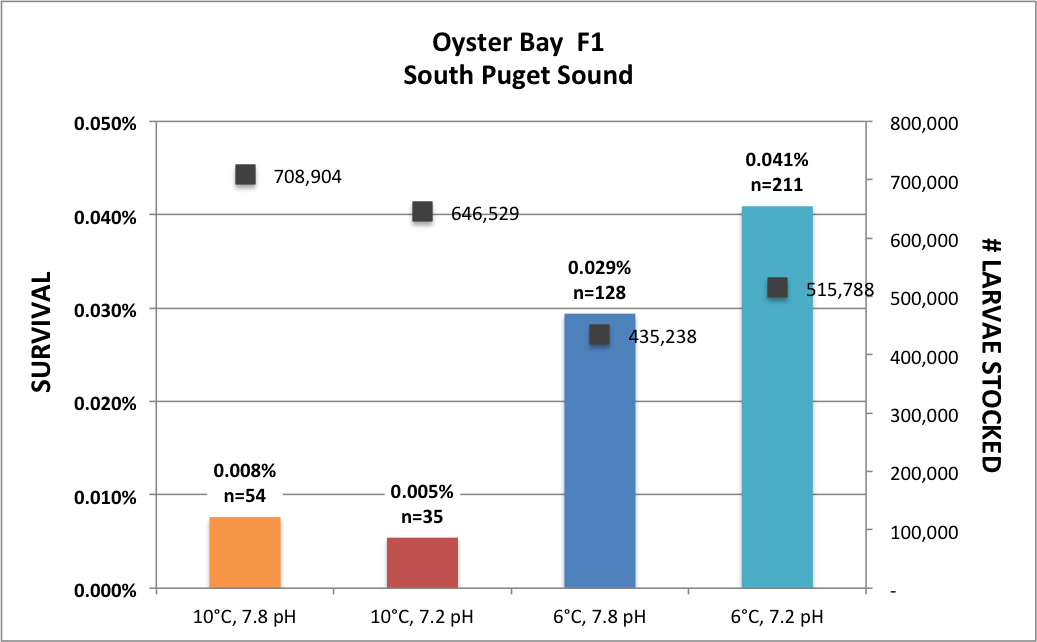
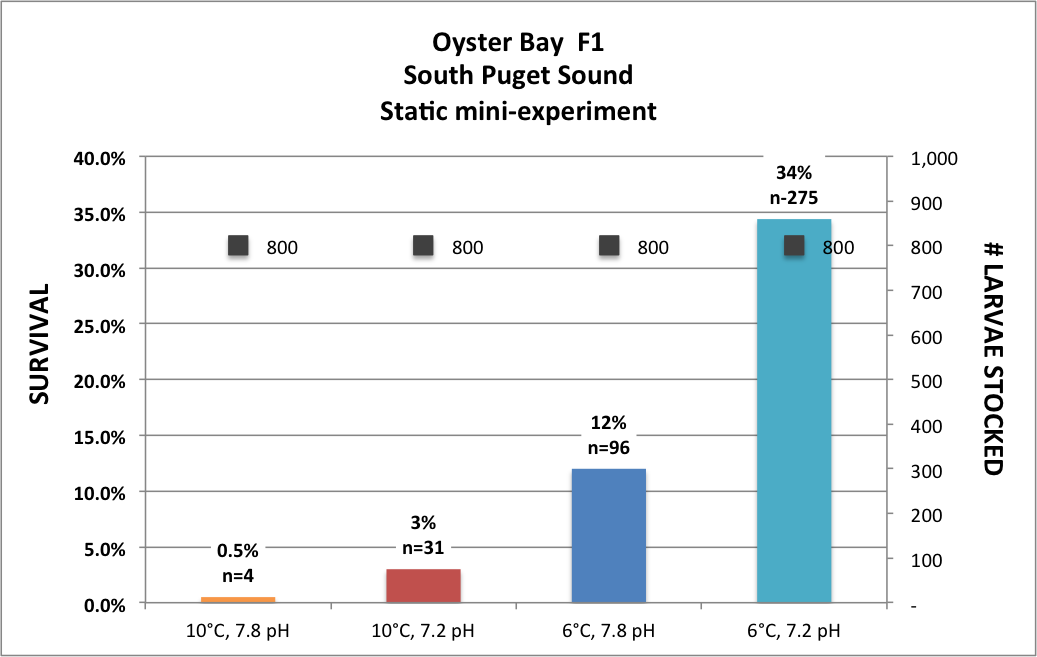
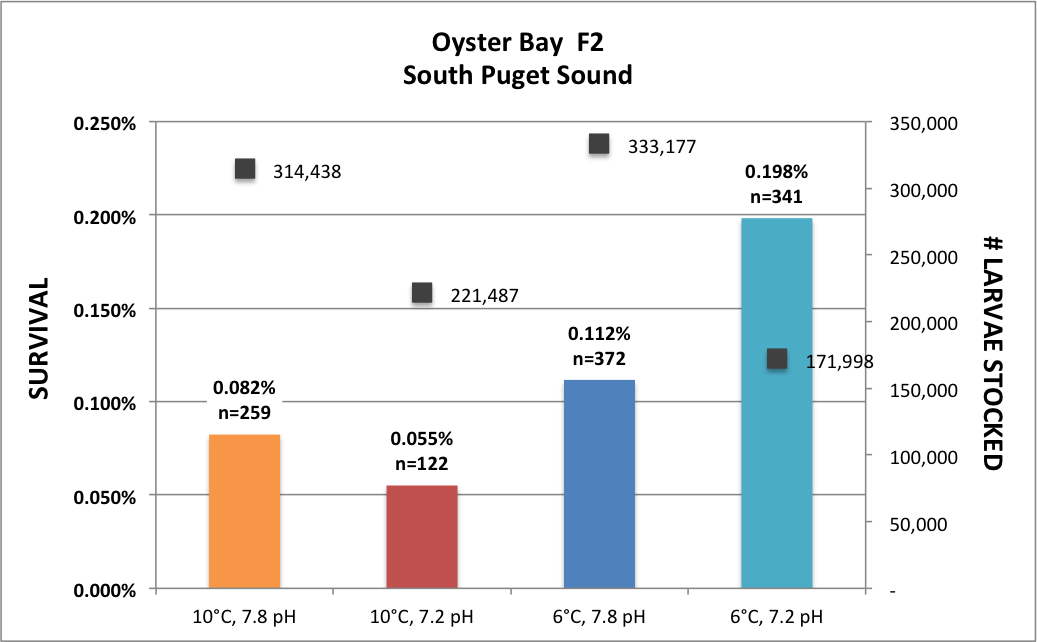
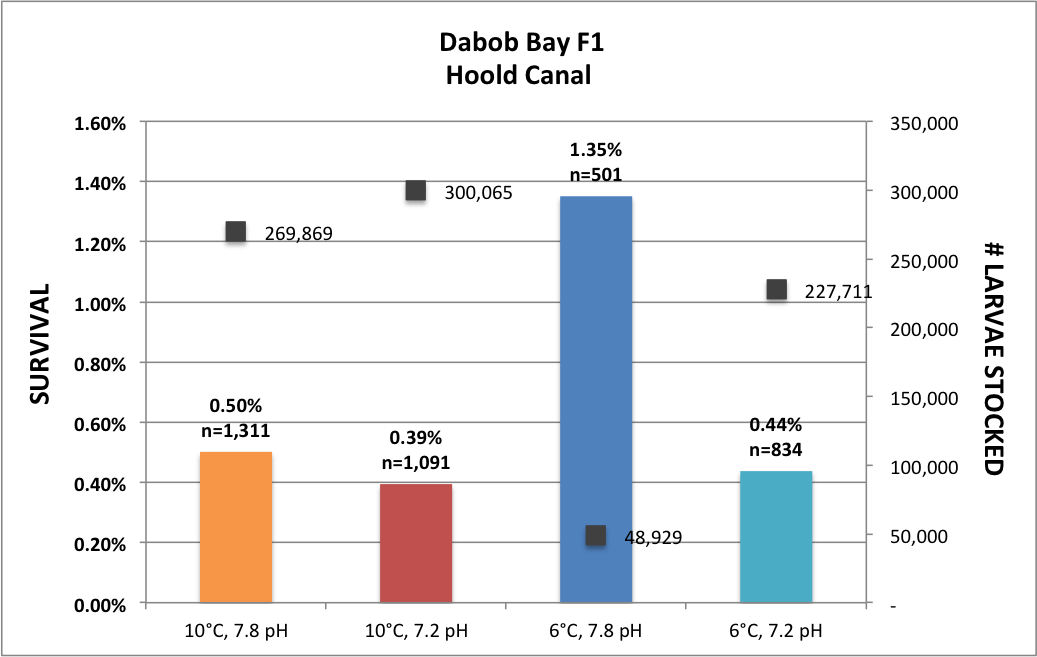
Charts include survival % within each population, as well as the total number of larvae stocked in culture buckets, for reference. As a reminder, larvae were continually stocked in culture buckets, with the maximum density of 200,000 larvae / bucket at any time. Continual stocking was possible due to a) graduating 224um larvae up to setting silos, and b) mortality. Also, reminder that I “culled” morts via a 2-bucket flow through system where all larvae were stocked in the first bucket, and only live larvae (which swim) flow into the second bucket, and the contents of the first bucket was discarded. Note: Hood Canal juveniles have yet to be counted, since they are too small, and therefore are not included in these charts.
Treatment groups are color coded as well as identified on the x-axis, where:
- Orange: High T (10degC), Ambient pH (7.8)
- Red: High T (10degC), Low pH (7.2)
- Blue: Ambient T (6degC), Ambient pH (7.8)
- Green: Ambient T (6degC), Low pH (7.2)