Survival data from Olympia oyster feeding/temp trial
Remember when I ran the Olympia oyster broodstock overwintering project, in which I held oysters in 2 temperatures (7, 10) and feeding regimes (low, high) for 3 months? No? check out these notebook entries: Experimental design post, and Broodstock fecundity post
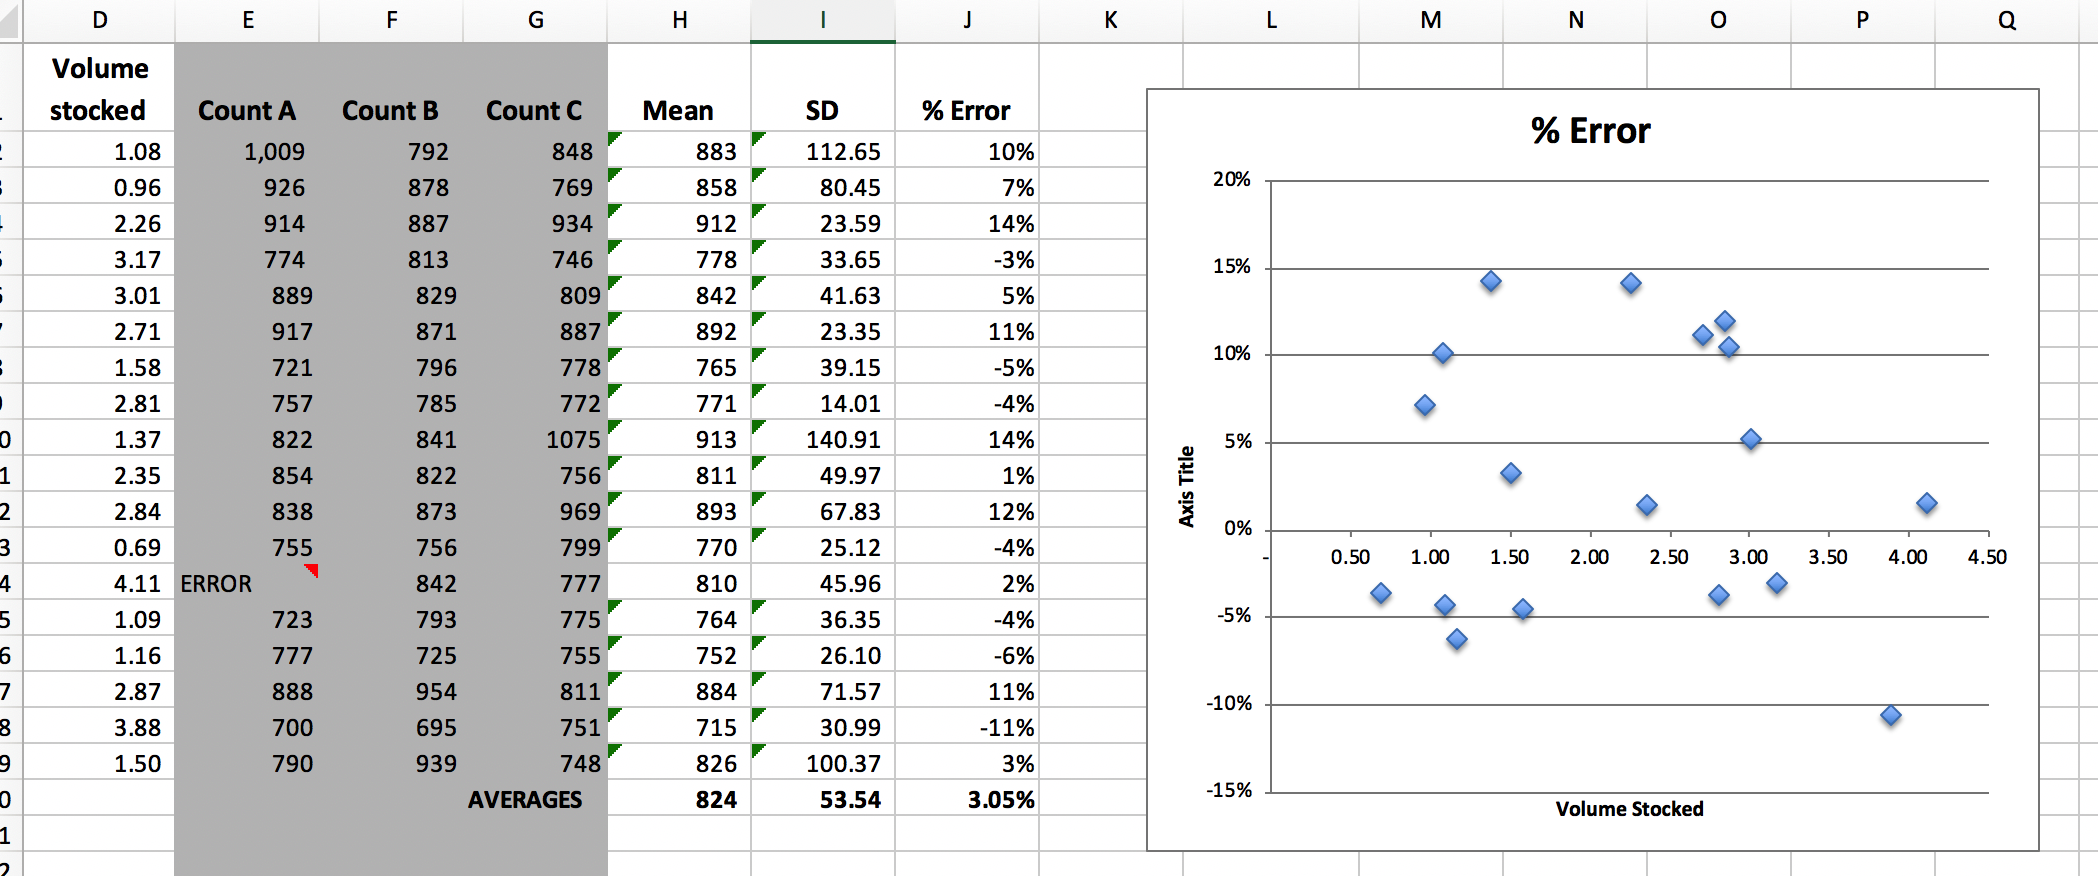
I grew 12 “families” per treatment separately in mini culture tanks (~800mL), each family had 3 replicates, a total of 144 silos. I stocked ~800 larvae per tank (according to my error checking I likely stocked 824+/-54 larvae, a ~3% error). I collected larvae from March 31st - April 19th. At day 50 for each collection group I counted the number of live post-set.
NOTE: I did save all these oysters in their respective groups, so depending on survival over the summer without being tended I have up to 48 separate families of olympia oysters from a minimum of 16 males/females (16 separate spawning buckets) - seems like someone should do something with them!
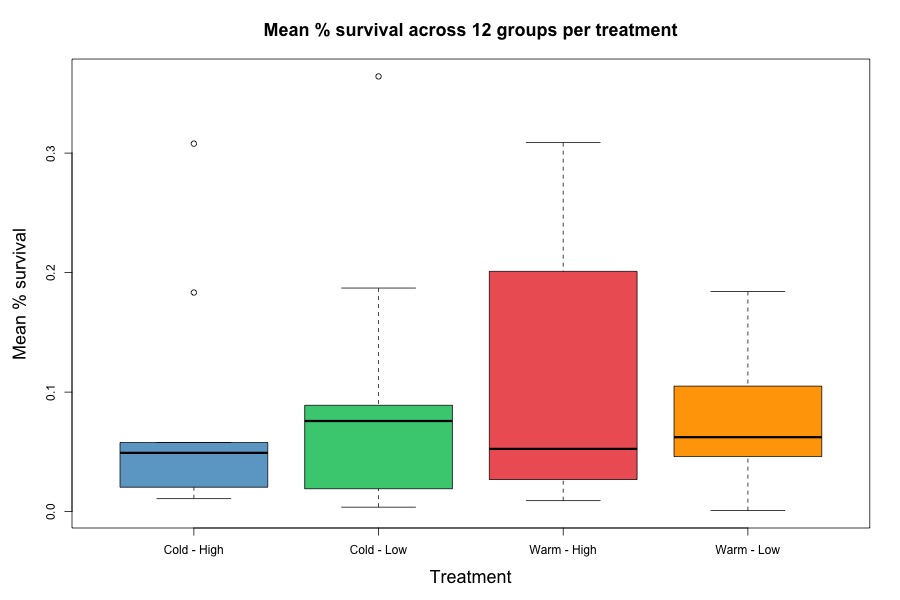
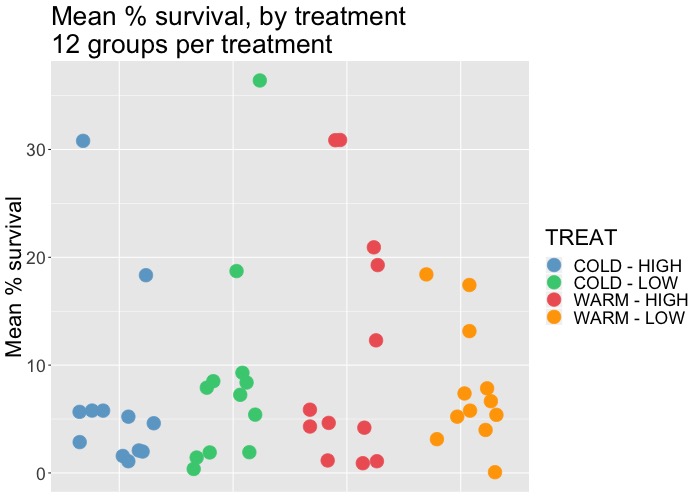
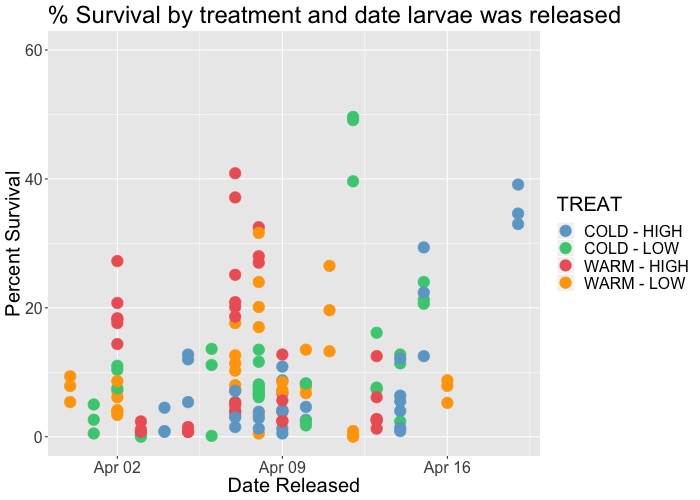
The following are a series of % survival plots, color coded by treatment. They show the data in two ways- simply by treatment, then by treatment over time. I noticed that some of the larval groups that were released later in the experiment had higher survival.
COLD-HIGH = Cold winter temp (7C), high food concentration (cell/mL TBD)
COLD-LOW = Cold temp (7C), low food
WARM-HIGH = Warm temp (10C), high food
WARM-LOW = Warm temp (10C), low food
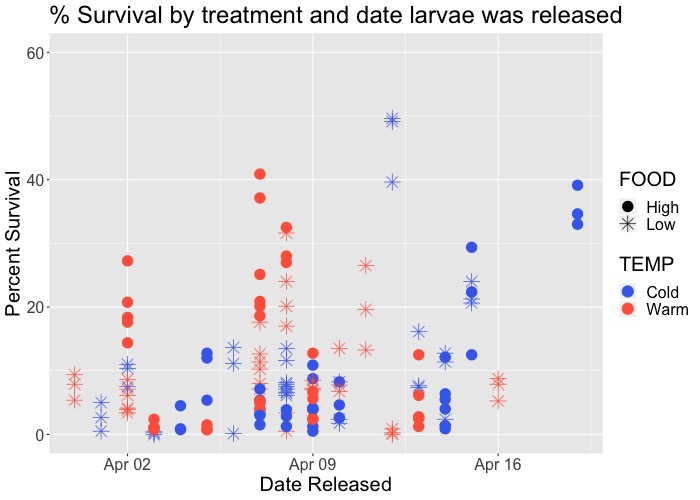
I ran binomial generalized linear models comparing treatments and time, and found no significant differences between either temperature or feeding levels. There was a marginal trend (p<0.1) towards higher survival with time, but not significant. Interesting that the winter feeding level had not effect!
Standard boxplot
Jitterplot of the same data, for a better look at the data spread
 .
.
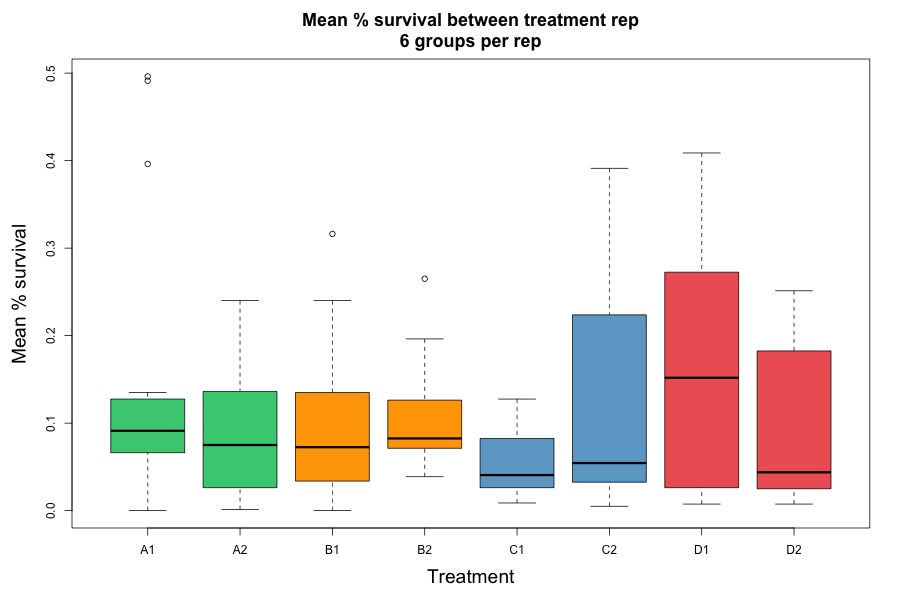
Another boxplot, this time the larvae from overwintering treatment replicates are separated.
% Survival color coded by treatment, but the x-axis is date I collected the larvae
Same data as previous plot, but coded differently
I’m pretty pleased with my low stocking error rate - here’s the data from my counts, and a plot showing error with respect to volume needed for 800 larvae: