Oly spawning charts
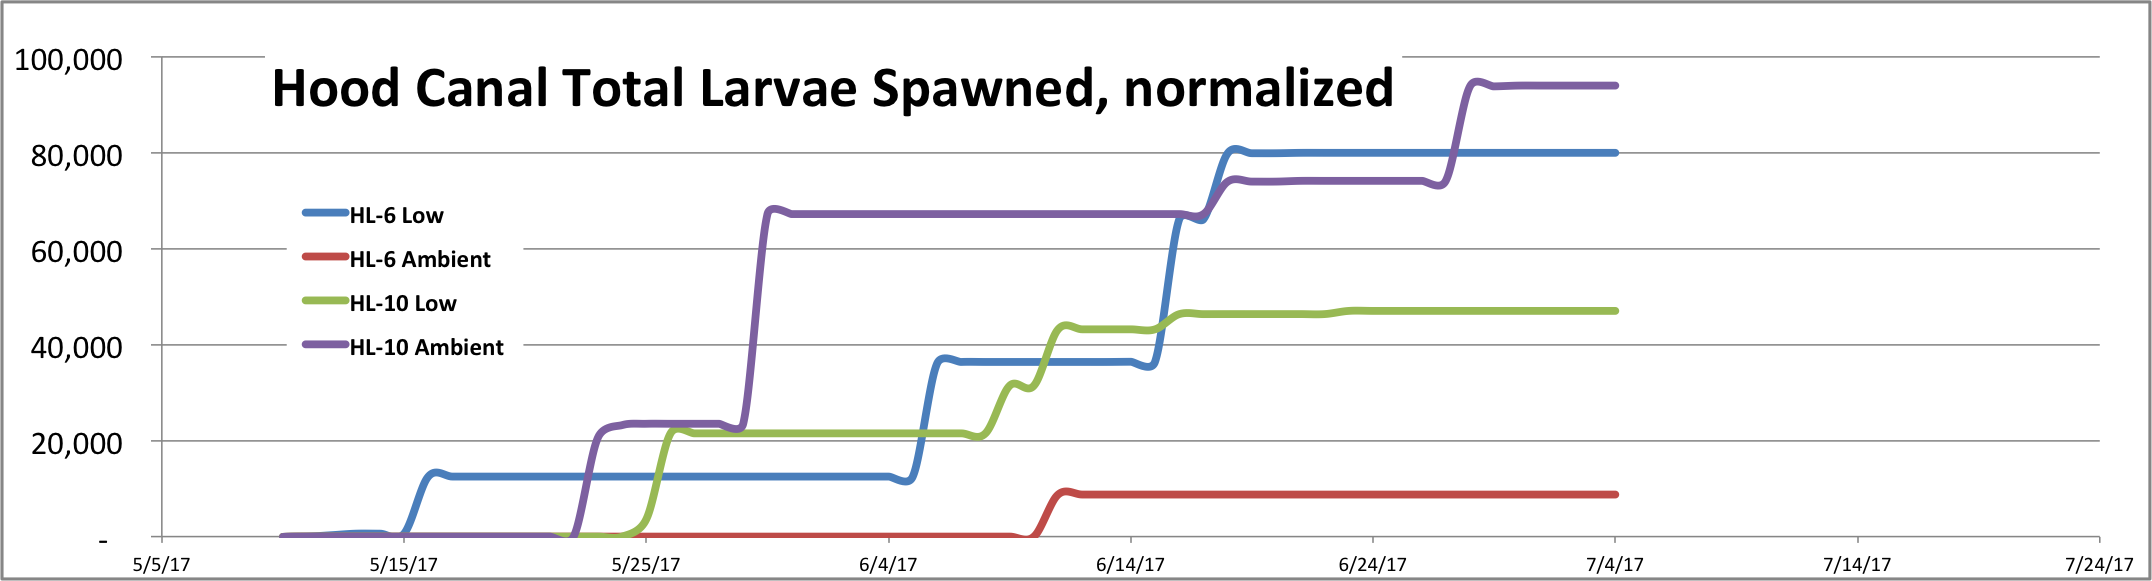
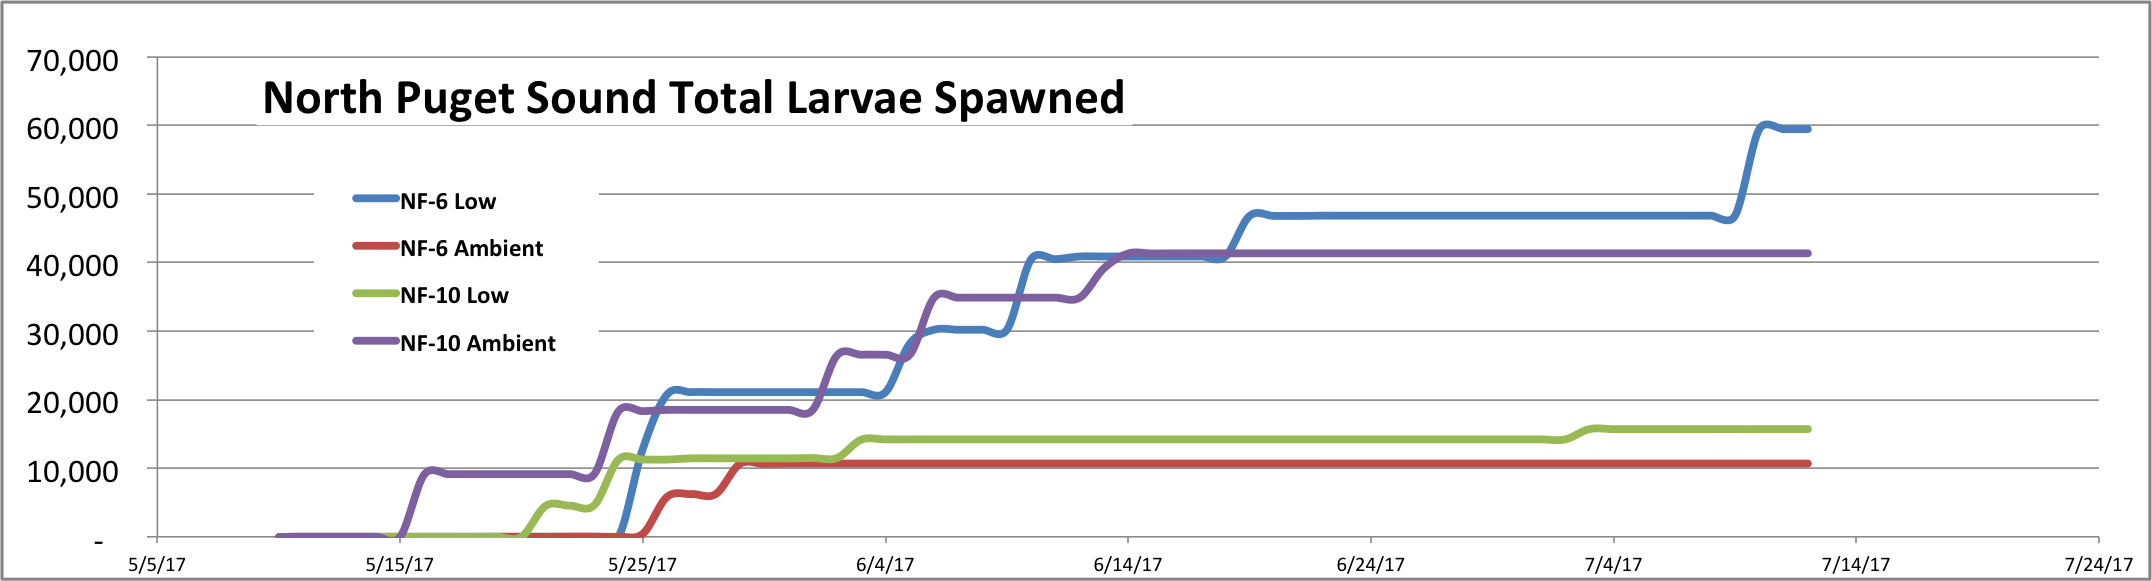
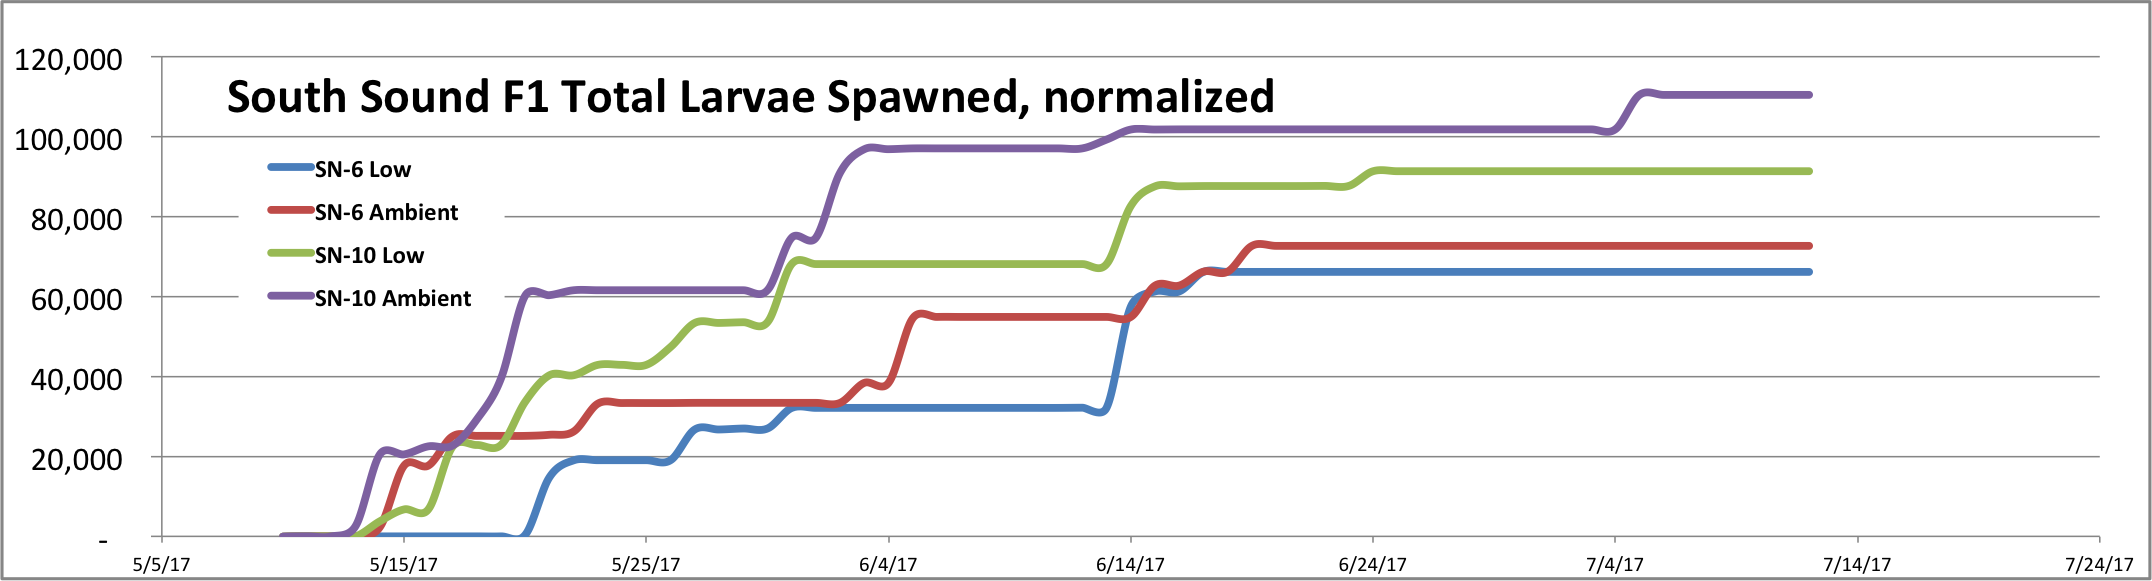
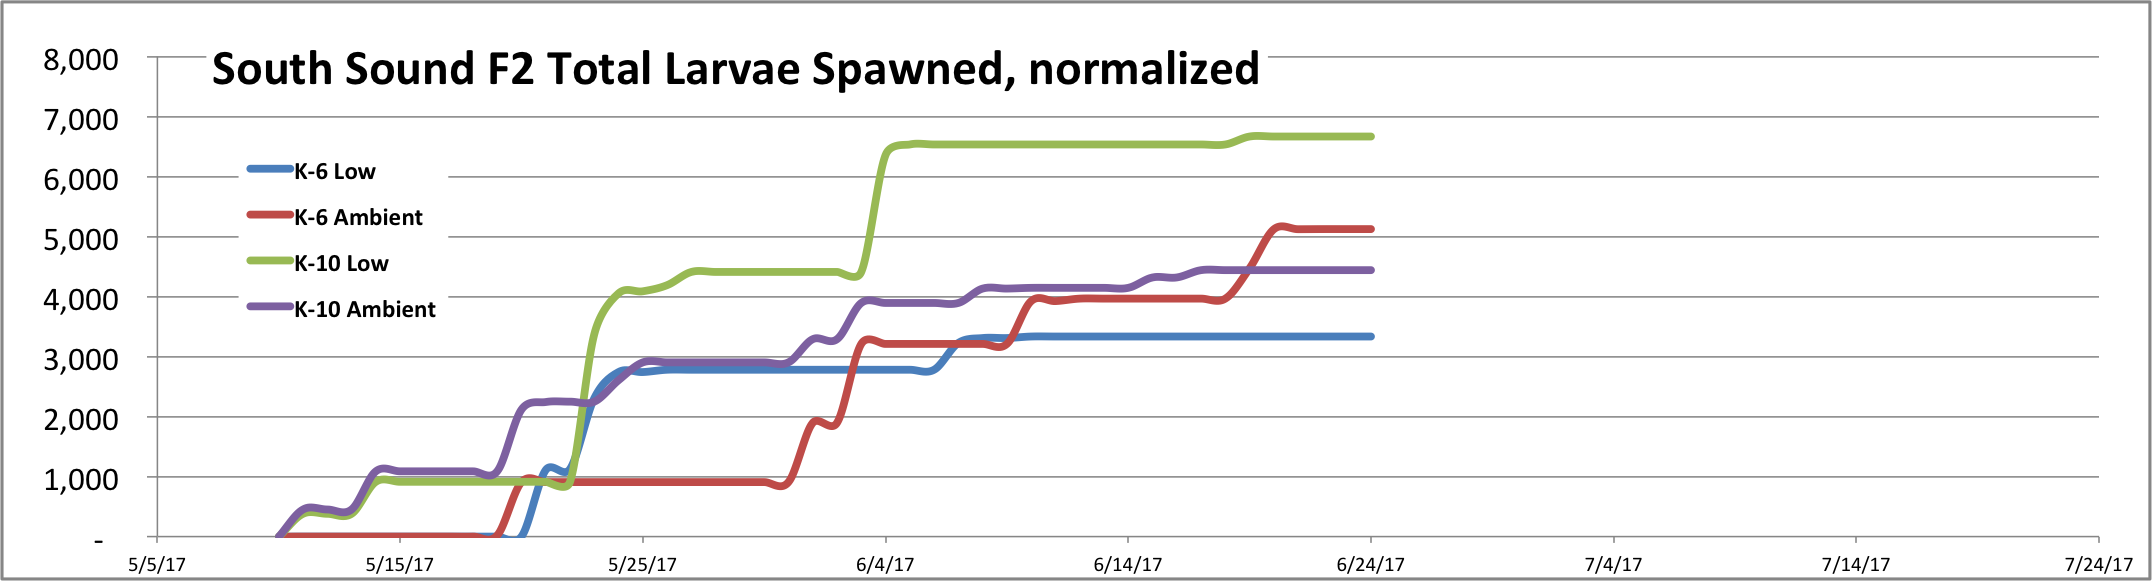
Here’s a quick visualization of the Olympia oyster spawning data from this spring. Each chart represents a population, and within the charts data is color coded by treatment.
Written on August 3, 2017

Lab notebook for Laura H. Spencer, PhD