
SRM data - quantifying tech. rep. quality
Today I figured out how to calculate distances between tech reps on the NMDS plot to numerically validate my removal of poor-quality reps. I ended up removing a few more reps (as compared to visually inspecting reps), but as a whole not much has changed. I also generated a couple plots using Plotly, which is fantastic. Plotly creates interactive plots so you can hover over points, zoom into a plot, etc.
Here is a plot of my technical replicate NMDS:
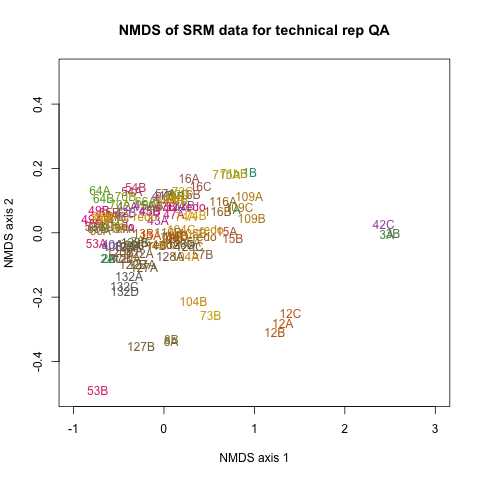
If you download this file and drag into your browser you can view it in Plotly: tech rep plotly (couldn’t quickly figure out how to render Plotly in my notebook; if you know how please let me know in comments!)
R script written to calculate euclidian distances between technical replicates on NMDS & plot via Plotly:
#### Calculate distances between tech rep points on NMDS plot and plot to ID technical rep outliers
library(reshape2)
srm.nmds.tech.distances <- NULL
for(i in 1:length(SRMsamples)) {
  G <- SRMsamples[i]
  D <- dist(SRM.nmds.samples.sorted[grepl(G, rownames(SRM.nmds.samples.sorted)),], method="euclidian")
  M <- melt(as.matrix(D), varnames = c("row", "col"))
  srm.nmds.tech.distances <- rbind(srm.nmds.tech.distances, M)
}
srm.nmds.tech.distances <- srm.nmds.tech.distances[!srm.nmds.tech.distances$value == 0,] #remove rows with value=0 (distance between same points)
srm.nmds.tech.distances[,1:2] <- apply(srm.nmds.tech.distances[,1:2], 2, function(y) gsub('G|G0|G00', '', y)) #remove extraneous "G00" from point names
library(ggplot2)
library(plotly)
p1 <- plot_ly(data=srm.nmds.tech.distances, y=~value, type="scatter", mode="text", text=~row)
htmlwidgets::saveWidget(as_widget(p1), "NMDS-technical-replicate-distances.html")
summary(srm.nmds.tech.distances$value)
bad.tech.reps <- srm.nmds.tech.distances[srm.nmds.tech.distances$value>.2,] #which tech rep distances are >0.2
View(bad.tech.reps)
Resulting “bad.tech.reps” were determined as distances >0.2 on NMDS plot/scale. This standard is still not good enough for publication; need to investigate NMDS stats to see if there is a sd, variance, or something that I can use to validate my 0.2 selection.
bad tech reps combinations >0.2
Plot of technical rep distances using Plotly: tech rep distances plotly