
Running list of R tips from super-advanced class
Cheat Seets: https://rstudio.com/resources/cheatsheets/
tidyverse
here() : https://cran.r-project.org/web/packages/here/index.html
read_csv(): the way to read in a csv file tidily (as opposed to ‘read.csv’). Read in all data using “read_THING()”
unite(): reshape a dataframe
filter(): subset a dataframe
select(): select certain columns in a tibble
mutate(): create a new column as a function of another function
pivot_longer(): convert a tibble from wide to long format
pivot_wider(): covert a tibble from long to wide
left_join(): take data set 1, and join matching values from data set 2 <– like bind/merge functions (but smarter)
right_join(): take data set 2, and join matching values from data set 1
inner_join(): join rows with matching values
full_join(): join all columns and rows
readxl package: fancy way to read in excel data - https://readxl.tidyverse.org/
purrr::modify_if(is.factor, as.character) - turn factors into characters (!)
tidyr::expand_grid() - provides factorial combinations of things (!)
broom::augment() - stats
purrr::safely() = wrap functions with safely(fctn), and it returns a list with two objects: the result of the function, and any error messages
stringr package
lubridate package
years()
year()
broom
tidying up stats results!!!
tidy(): Creates a tibble with results from stats functions !!
augment(): adds on statistics results to dataframe <— WOW!
janitor
clean_names(): cleans up column names by adding things like underscores
ggplot
facet_wrap(~factor, scales = 'free_y')+: make multiple plots by a factor (e.g. same plot repeated by population), and “free_y” adjusts each plots y axis
facet_grid(site~factor)+: make multiple plots by some factors, gridded out where everything on y=by site, and things on x=factor.
aes(col=factor, group=factor): try using group= in addition to color/shape etc. to ensure correct grouping.
Set a personalized theme that is frequently used, so not to repeat commonly used customizations
my_theme <- function(...) {
  theme(legend.title = element_blank(), #play around with turning these elements on and off one at a time
        plot.background = element_rect(),
        panel.background = element_rect(fill = 'white'), #color background of plot
        panel.border = element_rect(fill = NA), #border of plot
        panel.grid = element_blank(),
        legend.key = element_blank(),
  ...)
}
Multipanel plots: patchwork library: https://github.com/thomasp85/patchwork cowplot library:
Example of how to use cowplot for multipanel figures (this example in RMarkdown):
```{r cowplot, fig.width = 11}
a <- ggplot(...)
b <- ggplot(...)
plot_grid(a, b, ncol = 2)
```
Functions
Best practices:
- Always end a function with a
return() - If function produces a ton of information, you can end it with
invisible() formals()= arguments that you feed to the functionbody()= meat of the function, the code- You can set default arguments (aka formals) in functions when writing it. But, when calling the function you can give define arguments, which overwrite the deafult.
...- special arguent, allows you to pass additional arguments, that are unspecified in the function.
Functional programming
- “pure” functions = always spit out the same thing
- “impure” functions = results depend on the input
- Best practices is to group all your “impure” functions together
- Best practices - store each function in a separate file
!!(bang-bang) evaluates the contents of the enquoted variable- the program
purrris good for lots of things that apply functions do (see below) - In RStudio use “CODE -> INSERT ROXYGEN FORMAT” to autopopulate a roxygen header to describe a function
Example of how to use a function to create a ggplot, where you can feed it different variables. More complicated than you think:
foo <- function(data, histvar, fillvar) {
  histvar <- enquo(histvar) # captures what the user typed
  fillvar <- enquo(fillvar)
    data %>%
    ggplot(aes(!!histvar, fill = !!fillvar)) +
    geom_histogram()
}
foo(iris, Sepal.Length, Species)
Debugging
- first run
traceback(), which will estimate where in the function your error happened browser()= add this inside a function near the error, and it will walk you through how to find the error
purrr
-
map= workhorse, basically theapply()function: map(“Lists to apply function to”,”Function to apply across lists”,”Additional parameters”).
map(mtcars, mean, na.rm = T)# <– calculate the mean of mtcar columns, spits out as a vector -
map_THING()= there are lots ofmapvariations to define the output format
`map_df(mtcars, mean, na.rm=T) # <— calculate the mean of mtcar columns, spits out a dataframe (well, a tibble) -
map2()= allows you to apply a function to multiple lists. Example … map2_chr(c(‘one’,’two’,’red’,’blue’), c(‘fish’), paste) ## [1] “one fish” “two fish” “red fish” “blue fish”
A more explicit way of calling the paste with map2, using an anonymous function (~) -
map2_chr(c('one','two','red','blue'), c('fish'), ~paste(.x, .y))
Wrangling and leveraging lists
- `listviewer::jsonedit(MYLIST) - great way to interact with lists
- Tibbles let you store lists inside dataframe columns. (Handy for any time you want to organize a complex result (like a regression) in a dataframe.)
-
nest(). Here’s a really cool script that runs and returns lm objects for life expectancy by a country:gapminder %>% group_by(country) %>% nest() %>% mutate(foo_model = map(data, ~lm(lifeExp ~ gdpPercap, data = .x)))
Then, if we want to clean up the model output names using broom::tidy(), then unnest lists to show lm statistical results in dataframe format:
  gapminder %>%
    group_by(country) %>%
    nest() %>%
mutate(foo_model = map(data, ~lm(lifeExp ~ gdpPercap, data = .x))) %>%
mutate(foo_coefs = map(foo_model, broom::tidy)) %>%
unnest(cols = foo_coefs)
Wramgling lists with purrr
-
Extract items from a list with `map_chr(‘COLUMN NAME’). Example, “got_chars” is a list containing information about game of thrones characters. So, to get items in the “names” column from the first 5 items in the list:
  got_chars[1:5] %>%
      map_chr('name') Another example:

  thing <- list(list(y = 2, z = list(w = 'hello')),  # create imbedded list (russian doll)
          list(y = 2, z = list(w = 'world')))
   map_chr(thing, c("z","w"))
Another example, where we apply the function [ to extract names and allegiances of characters from the first 5 people in the list of game of throwns charaters:
    got_chars[1:5] %>%
      map(`[`, c('name', 'allegiances'))
Putting things together, now suppose that we want to find all the Lanisters in the GoT list. The ~ in the map_lgl function is used to tell R that the next thing is a function, not the name of a thing.
    names <- map_chr(got_chars, "name")
    is_lannister <- map_lgl(names, ~ stringr::str_detect(.x, "Lannister"))
    got_chars %>%
      purrr::set_names(names) %>%
      purrr::keep(is_lannister) %>%
      listviewer::jsonedit()
RMarkdown
- RMarkdown cheatsheet
- x~i~ for for subscript
- x^2^ for subscript
- Writing with color:
Roses are $\color{red}{\text{beautiful red}}$, violets are $\color{blue}{\text{lovely blue}}$. - Remember to use
here()to read in / save files:here::here("data","mydata.csv") - Can include R code in-line in text!!! (Wow). Just add an “r “ before calling an R object that was previously defined, for instance:
r my_amazing_result - Equations: use $ for inline equations (e.g. $x = \beta^2$) and $$ for centered/new paragraph equation.
-
knitr::kable()function can be used to format tables. (e.g. below). Other packages for highly customized table formatting include:kableExtra,gt. Formatting regression tables =stargazer,xtable,huxtable/huxreg.knitr::kable(head(mtcars), caption = "My Table", format = "html") - RMarkdown has a table of contents view option:
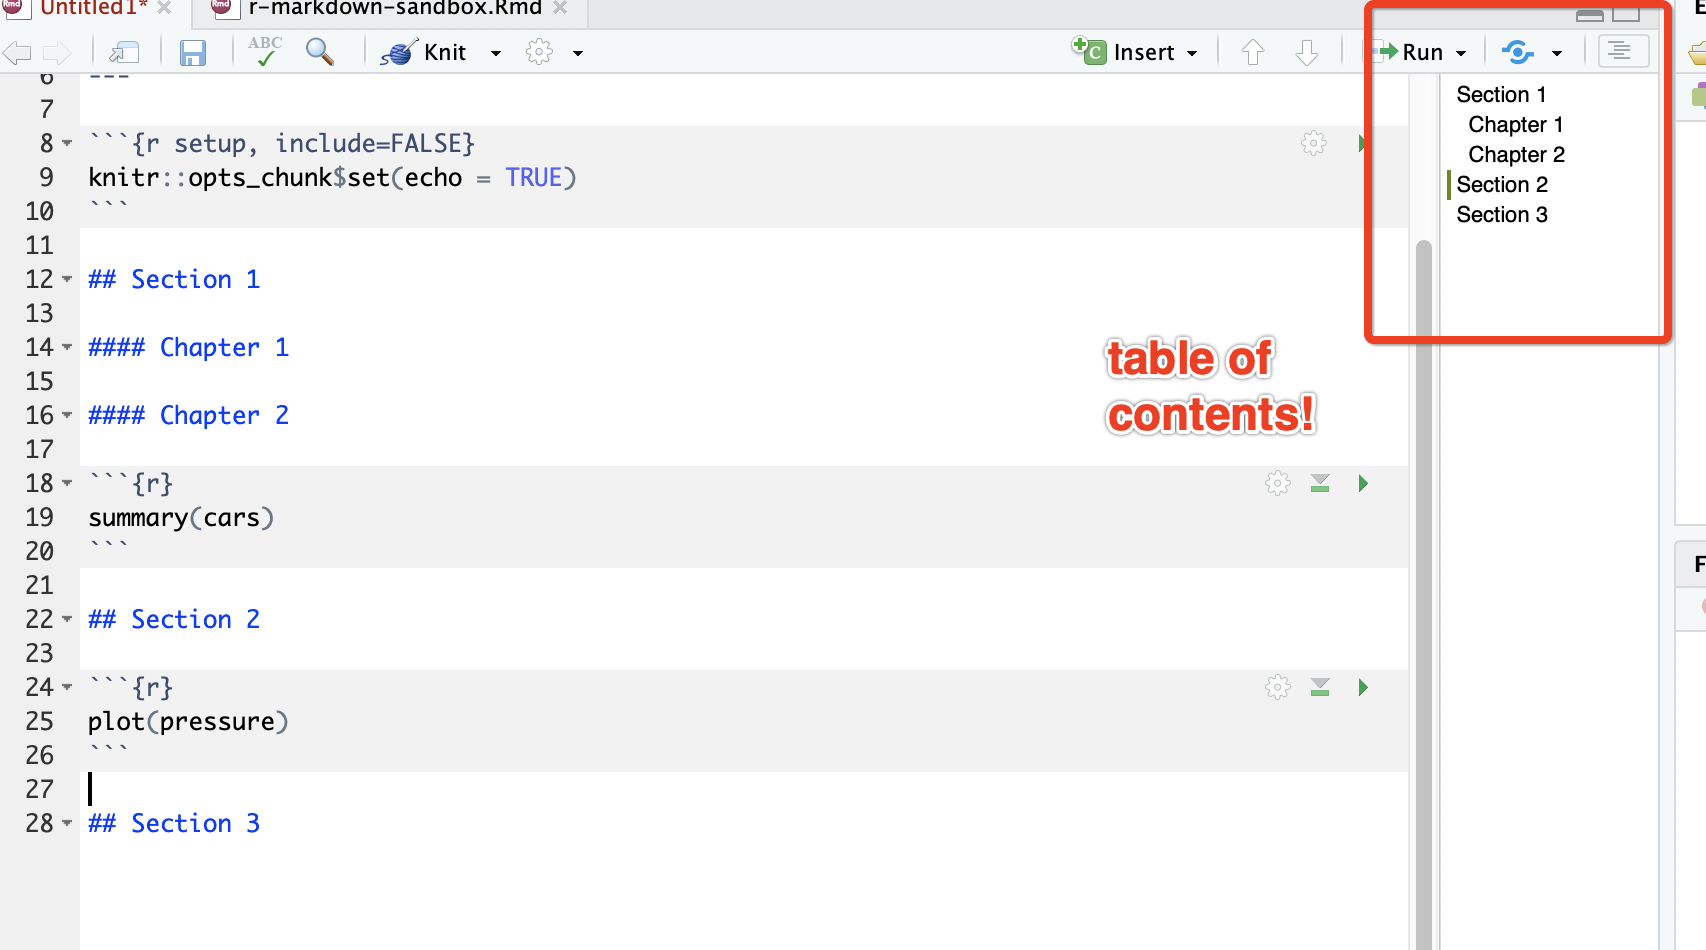
The YAML at the beginning:
---
title: "My Brilliant Paper"
author: "Awesome Me"
date: "2019-11-03"
output:
  pdf_document: default
  html_document:
    toc: yes
    float_toc: yes
---
Setup code chunk example to load things that won’t be included in knitted file
{r setup, include=false}  #<--- applies to just this chunk
library(tidyverse)
knitr::opts_opts_chunk$set(echo=FALSE)  # <--- applies to all chunks (but can override in a chunk).
RMarkdown chunk setup options
cache=TRUE: Good for formatting debugging, or running just re-running a subset of chunks. It saves results from code chunks, and only changes results if that chunk has change. Don’t use for re-running full analysis.
eval=FALSE: doesn’t evaluate that chunk
{python}: run code in python
echo = FALSE: Hide the actual code in each chunk (just show results)
warning = FALSE: Hide all warning messages
fig.dim = c(6,4): All plots are 6inch wide and 4 inches high
fig.align = "center": And all plots centered
results="asis": need to use this when creating a table. Note: table formatting can be finicky, need to specify format=latex for PDF format, and format=html for HTML format.
error=TRUE: if an error is encountered in the code chunk, continue knitting running rest of RMarkdown file. If error=FALSE knitr stops when it encounters an error.
bookdown to write papers in RMarkdown
- Use
bookdownprogram to write and knit to bookdown document - Write entire papers
- Use cross referencing to keep figures, tables, etc. dynamic (if a figure moves, that # and references change automatically)
- Citation managing - export a .bib file from citation manager, add that to YAML. Also specify the citation style in YAML using a .csl file which can be found in this zotero repository. Reference are formatting this way: [@aristotle320BC;@cat2019]; in-line just use the @ symbol, for instance @cat2019 is the source.
Parallelling etc.
htop- not automatically on computer, similar totopin that it shows which programs are running, but with pretty graphics.- Beeper package - creates sound when process is complete, can be customized.
- doParallel program - run processes in parallel.
- To run R script from terminal:
Rscript [script name](may have to add Rscript to path”