
Retention Time R2 Calcs
One of the first steps in processing SRM data is to confirm that the selected peaks actually represent the peptides, aka that our assay works. To do this, we use linear regression between PRTC retention times in DIA and SRM to calculate predicted transition RTs in collected SRM data. Then, we calculate the R^2 for PRTC and experimental peptides compared to predicted.
Step 1
Copied PRTC peptides from another Skyline project file, pasted into my Geoduck assay Skyline file.

Step 2
The method file used in mass spec run resulted in us not collecting all PRTC peptides, so I removed those from the Skyline document.

Some of the PRTC peptides had no signal in several of my replicates. These peptides eluted at ~14 or 18 minutes. I removed the peaks from all reps which had no signal at the predicted RT. In this screen shot the peptides with lots of signal missing are unfolded on the left side, and one of the cruddy reps’ chromatogram is pulled up. There should be a peak @ around 17mins.

Notice that the PRTC peptide signals vary, which is due to me using different PRTC mixes. I documented which mix I used, and the concentrations of each, so I will need to account for that when I normalize my assay daya using PRTC data. More on that later.
Step 3
Exported retention times from Skyline via File -> Export -> Report -> Peptide RT Results. Saved in my Geoduck-DNR Repo as 2017-08-11-SRM-Retention-Times.csv

Step 4
In Excel: Use all SRM replicates’ PRTC retention times to calculate average, then regress against DIA. Spreadsheet with calcs and plots are saved in my Geoduck-DNR/2017-August_SRM-Analysis Repo
First, I opened SRM RT data, copied and pasted PRTC data & pasted into new spreadsheet. Removed all #N/A values (via Find/Replace function), then averaged all replicate RT for each peptide. Results (and notice averageif() equation):

Regressed the average PRTC retention time (RT) in SRM against DIA:

Averaged predictions over all DIA replicates:

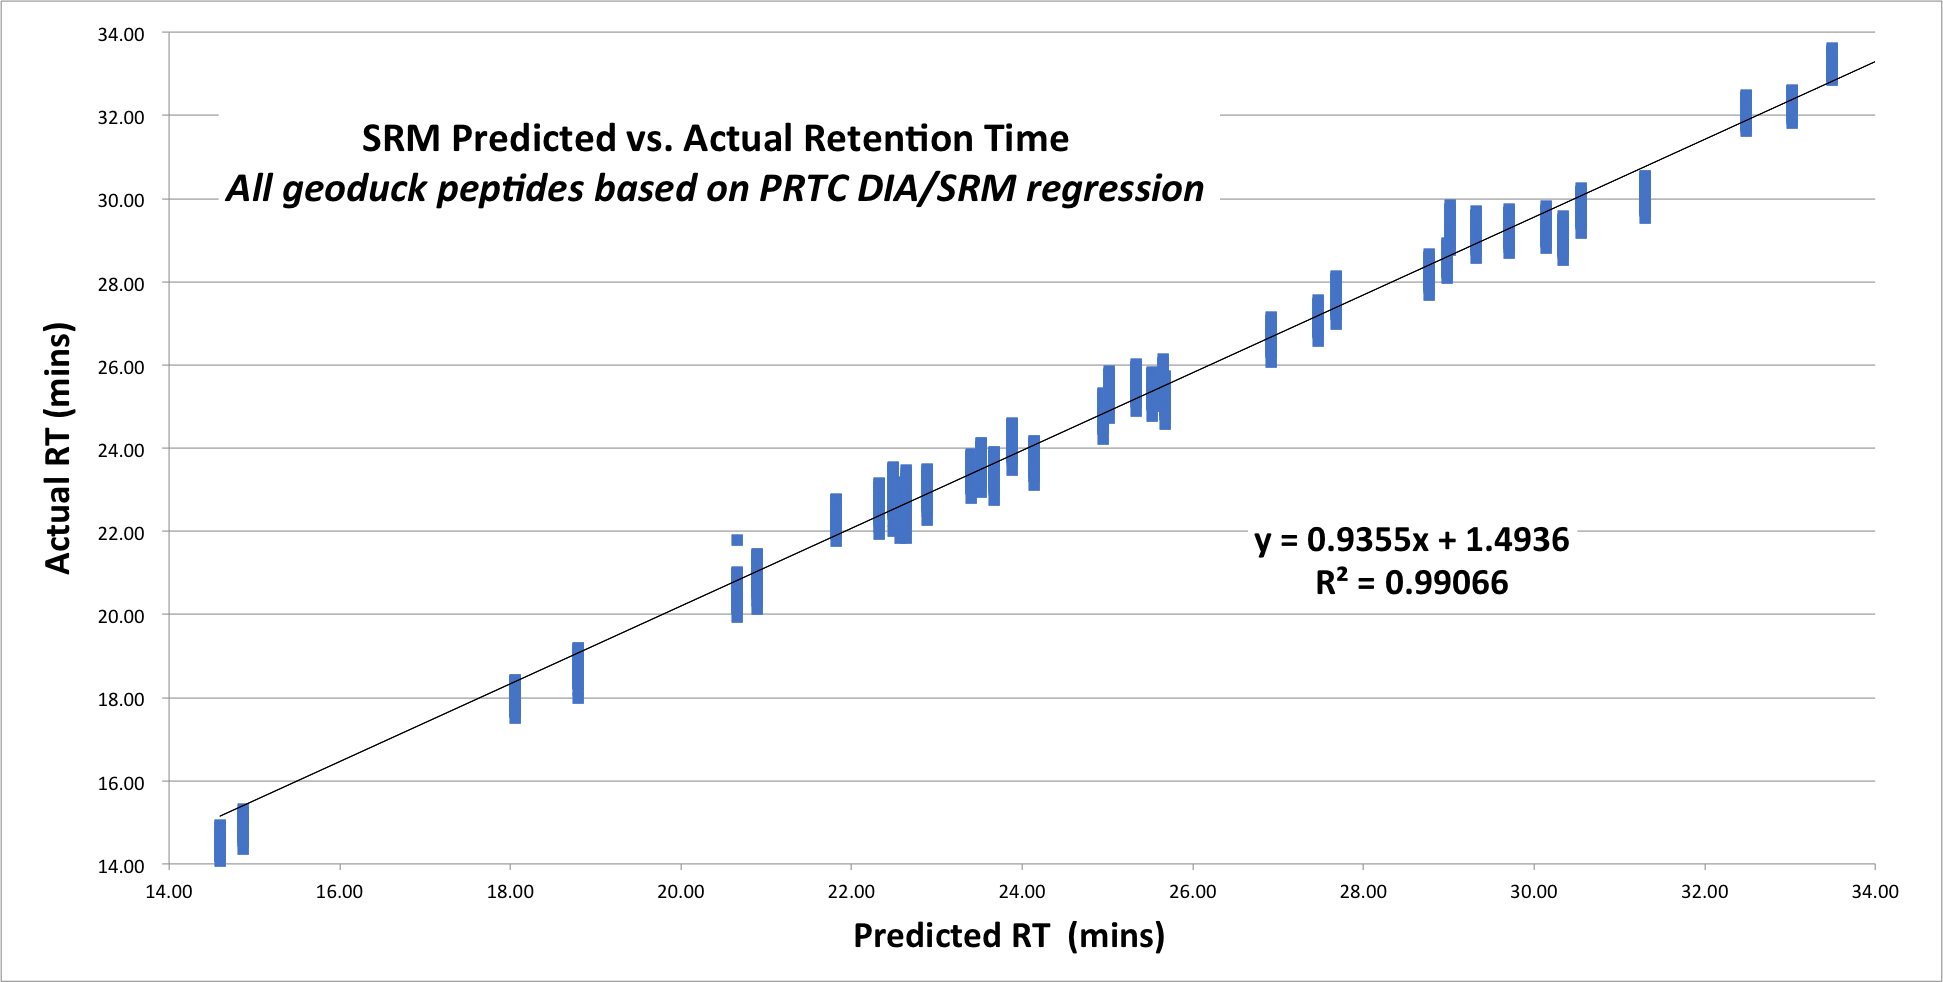
Compared predicted vs. actual RT in SRM:
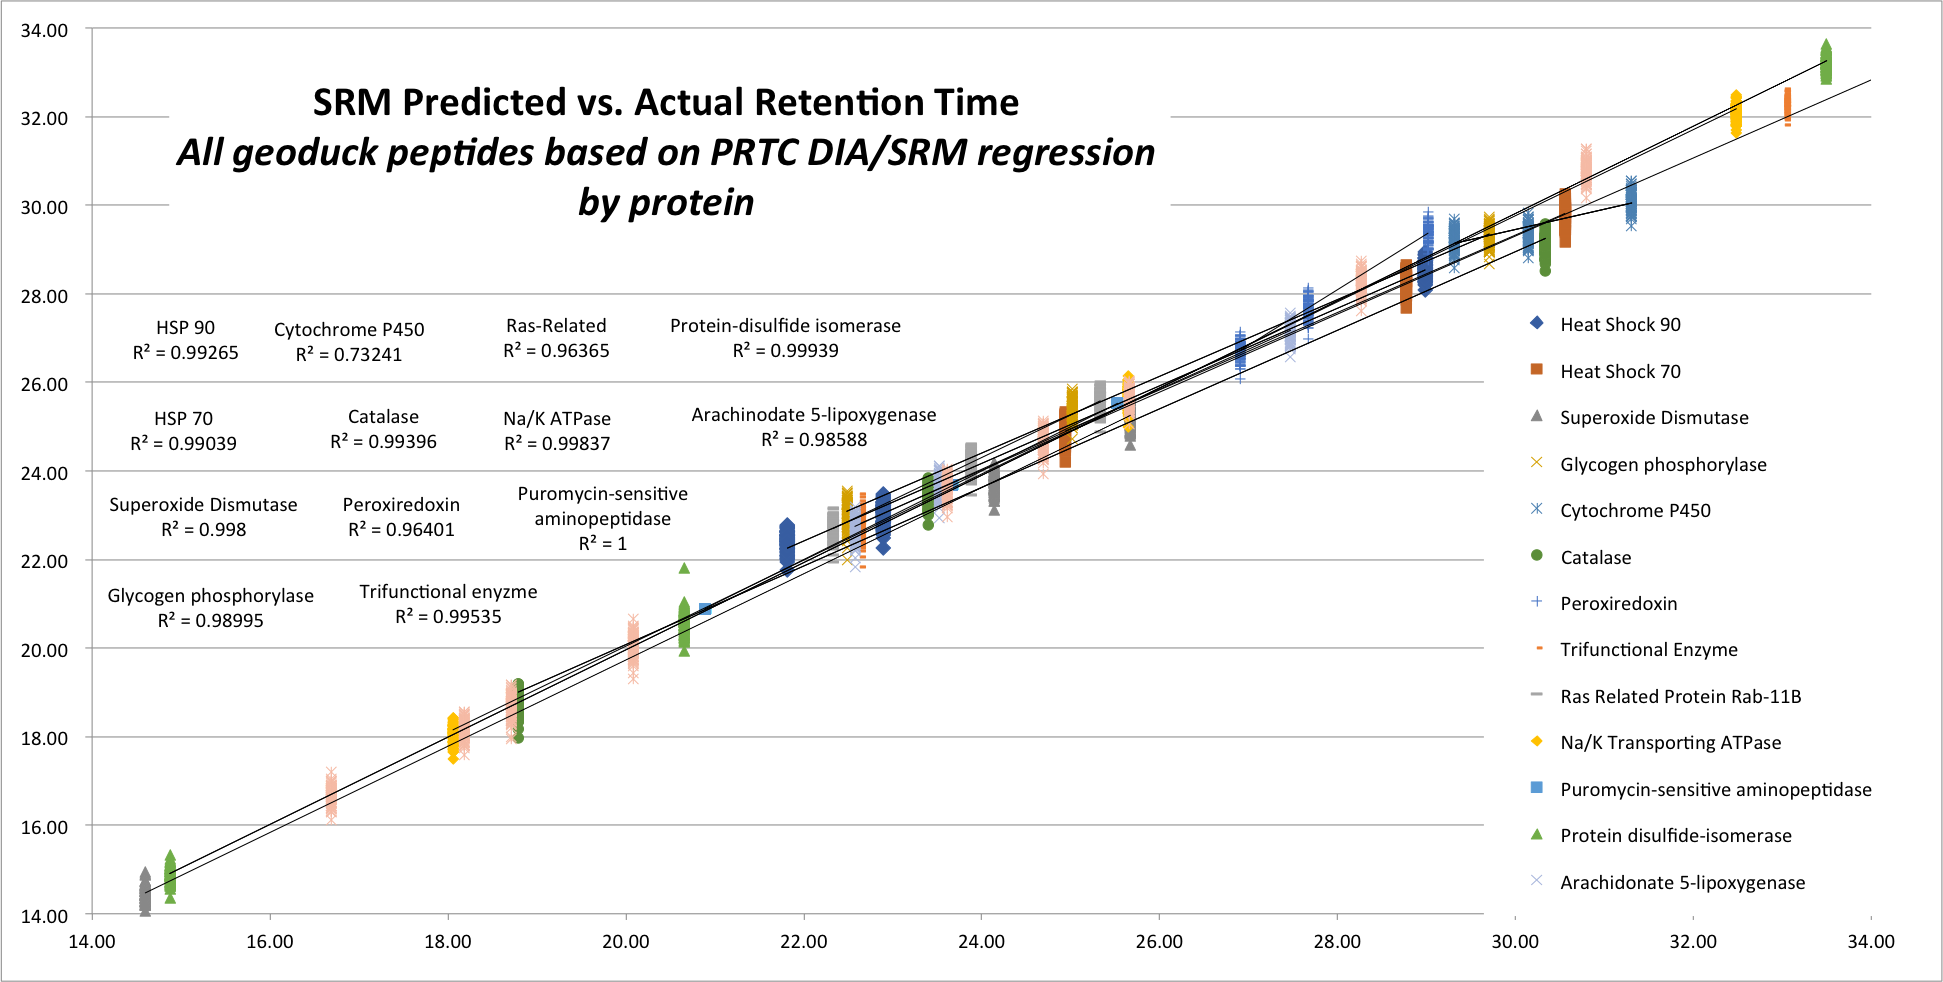
All proteins but Cytochrome P450 have R^2 > 0.96. I’ll have to investigate what’s up with Cytochrome P450 RT to see what might be the culprit.