DO Data from WA Ecology & DO Outlier Scrub re-do
In an effort to QC the dissolved oxygen data from the DNR geoduck outplant, I checked out WA Ecology’s online tool, the Environmental Information Management (EIM) System.
Here’s the website layout. I opted to search under the Results field

After experimenting a bit with search options, I searched for “dissolved oxygen”:

Here is a shot of the results table. I then downloaded all results.

The downloaded results file was a .csv. I opened in Excel and generated 2 histograms: 1) All DO data points measured in mg/L; 2) All DO data points measured in mg/L AND measurements from marine/salt/brackish water.


Main take-away: All DO data ranged from 0-21 mg/L, therefore the data points in the DNR dataset >21 should not be included in my data analysis.
Re-running outlier scrub on environmental data
Based on Yaamini’s information that after scrubbing for outliers she does not have DO values as high as I do (highest is in the 20’s mg/L), I decided to check out her method of scrubbing outliers. She used the Tukey inner-fence method, which removes any values greater than 1.5 times the inner-quartile range (IQR). The IQR is the distance between the lower (Q1, 25%) and upper (Q3, 75%) quartiles:
- IQR = Q3 - Q1
- Upper bound = Q1 - 1.5 * IQR
- Lower bound = Q3 + 1.5 * IQR
I reviewed the outlier removal script that I had used previously, and it actually uses the same method. Regardless, I re-wrote my script with help from Yaamini’s script, scrubbed for outliers, then plotted the results and compared my pre- and post- quartile ranges. It turns out that the reason I have higher DO values than Yaamini is that I am using data from all sites, including eelgrass patches, and Yaamini is only using bare sites. The Fidalgo Bay-Eelgrass site had much larger variation, with values as high as ~40 mg/L. In speaking with Graham Young and Chris Monson, they have never seen values that exceed ~13mg/l. I’m just not sure I can trust the DO data from FB at this point, and will need to consult furthere with Micah to see if we can identify an explanation. For example, is it possible that the FB DO data is in a different unit?
Pre-outlier scrub environmental data time series plots:
Post-outlier scrub environmental data time series plots:
- Dissolved Oxygen
- pH
- Salinity
- Temperature and tidal data not adjusted
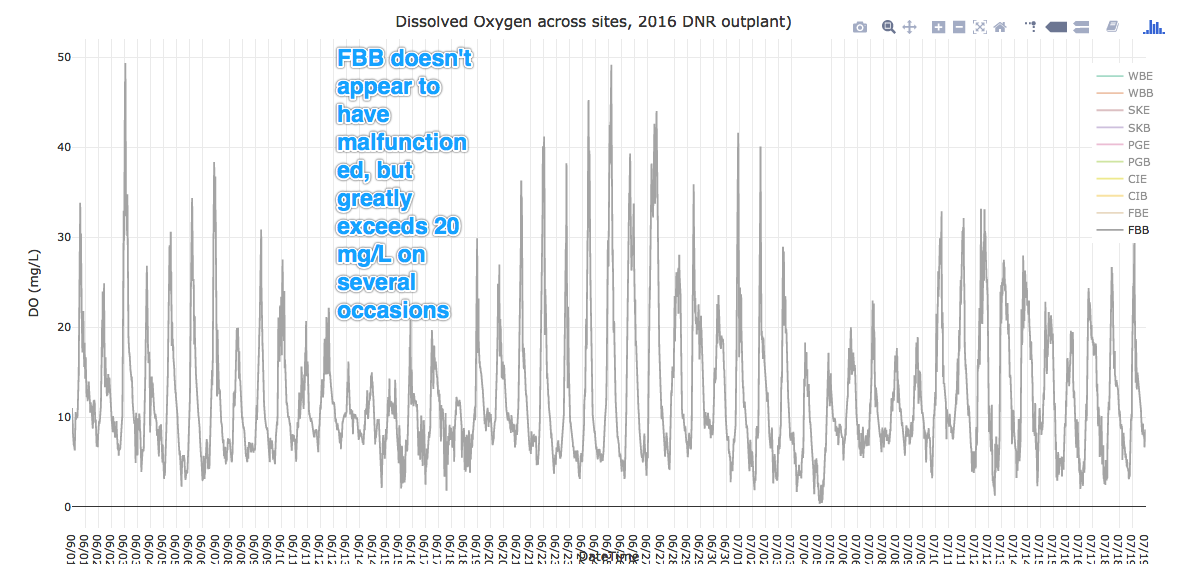
Update: Re-visited FB-eelgrass DO data, found probe malfunction
I took another look at the FBE DO data, and realized that the probe had likely malfunctioned/was buried in sediment on 6/24/16 @ 08:40. I thus removed all data points after that date, then re-scrubbed outliers, generated summary stats and plotted. This improves data from that site quite a bit. Here’s a quick look at the raw DO data from FBE & FBB for comparison. Click on the above “post-outlier scrub” time series plots for the up-to-date version of that data. You’ll see that there still are values as high as 27 mg/L.