Oly OA gonad histology & spawning data options
I’ve come full circle with my data from the Olympia oyster adult OA exposure project from 2017. After agonizing over the data for months (…years?), I’m moving forward with population-specific analysis, focusing on the effect of low pH on gonad & fecundity, with some minor findings regarding the offspring. Until a couple days ago I was all set to just use data from the 6C pre-treatment temperature groups (overwintered at 6C), but since we are now looking at population specific effects I may want to include the 10C groups (overwintered at 10C). The reasons to include both temperature groups are a) very simliar gonad results in both groups, b) more spawning data which support the population-specific reproduction theme, and c) I can refer to this paper when I write my QuantSeq paper (since RNA from larvae was from 10-low pH and 6-amb pH). If I go this route I will not analyze the 10C survival/growth data.
I’ve prepared some new figure options, particularly for the gonad histology data:
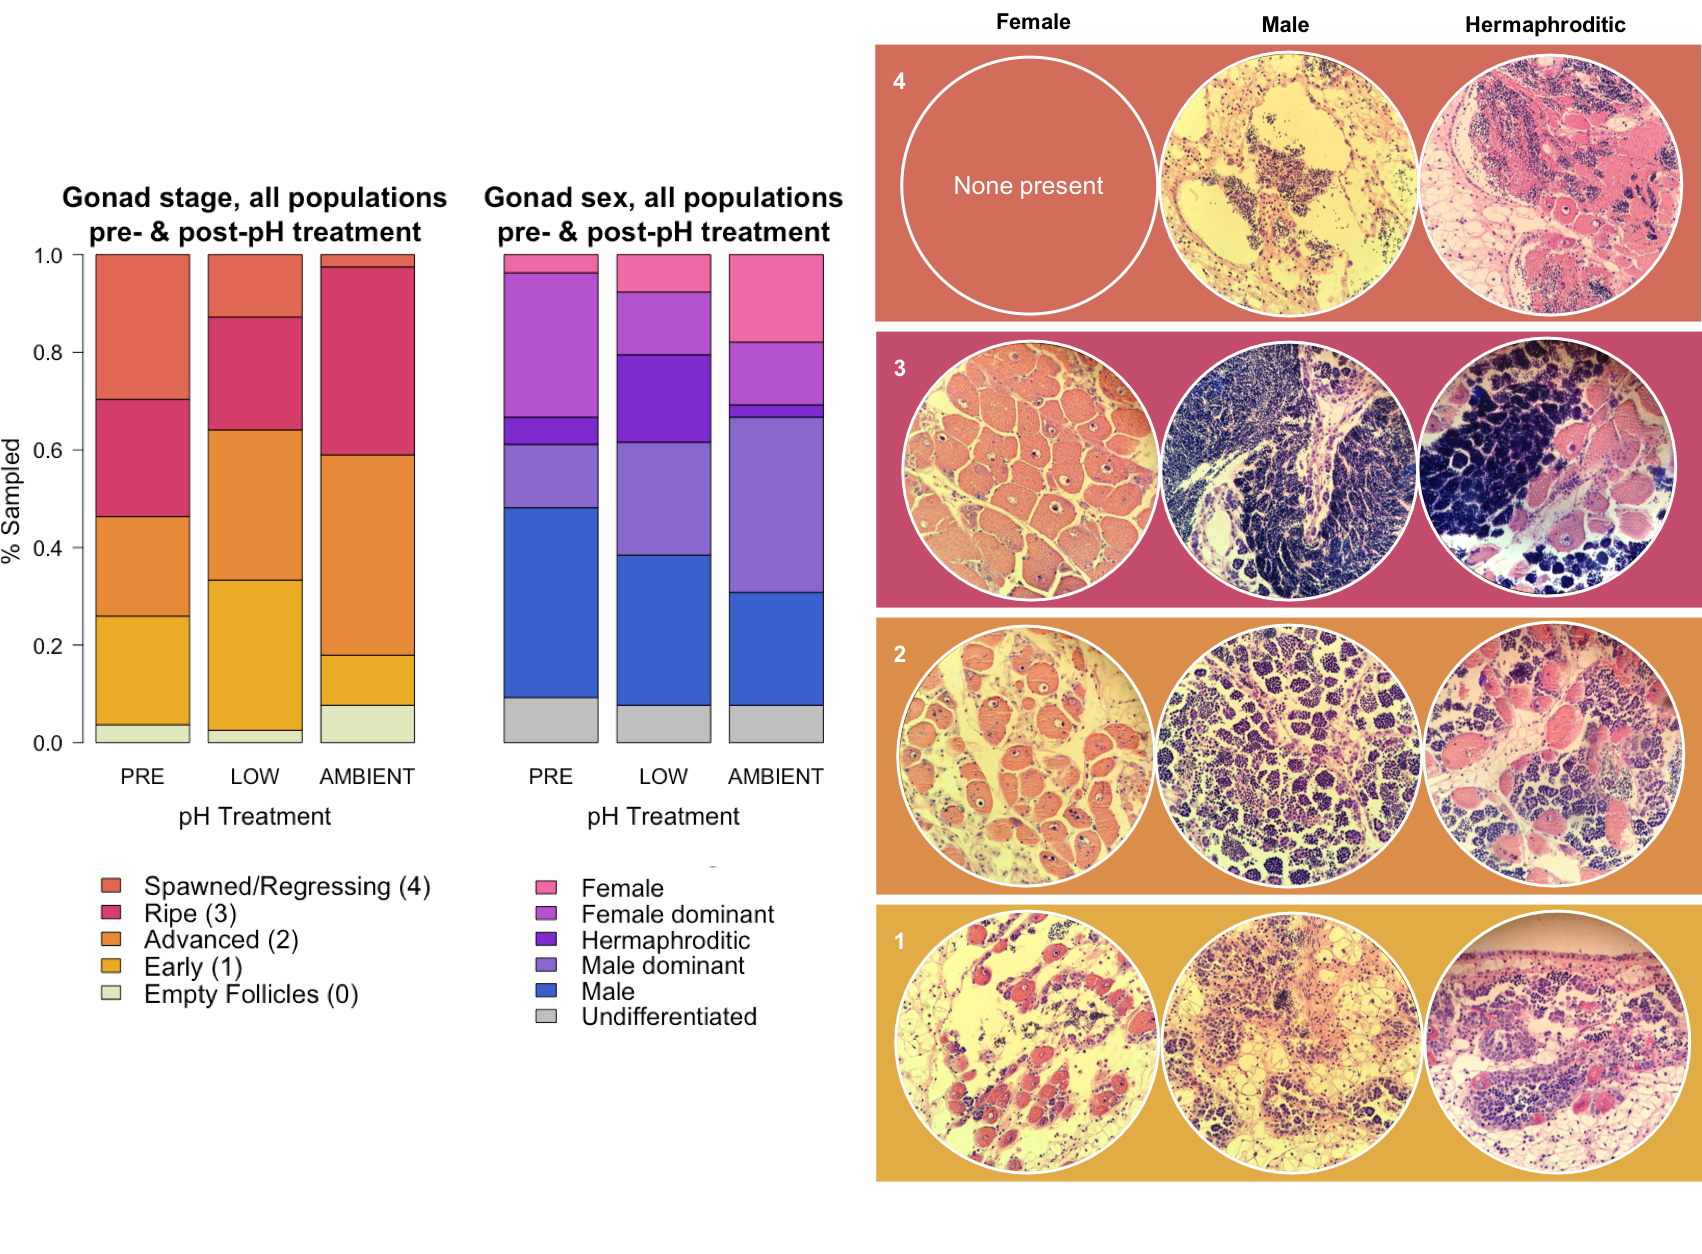
6C gonad data only, showing dominant stage, sex, and example gonad tissue
Gonad stage before pH treatment (n=54) and after 52 days in ambient pH (7.82±0.02, n=39) and low pH (7.31±0.02, n=39) for all populations combined. Gonad differed significantly between pH treatments (𝝌2=9.79, p=0.032), and between pre-treatment and ambient pH (𝝌2=6.61, p=0.146)
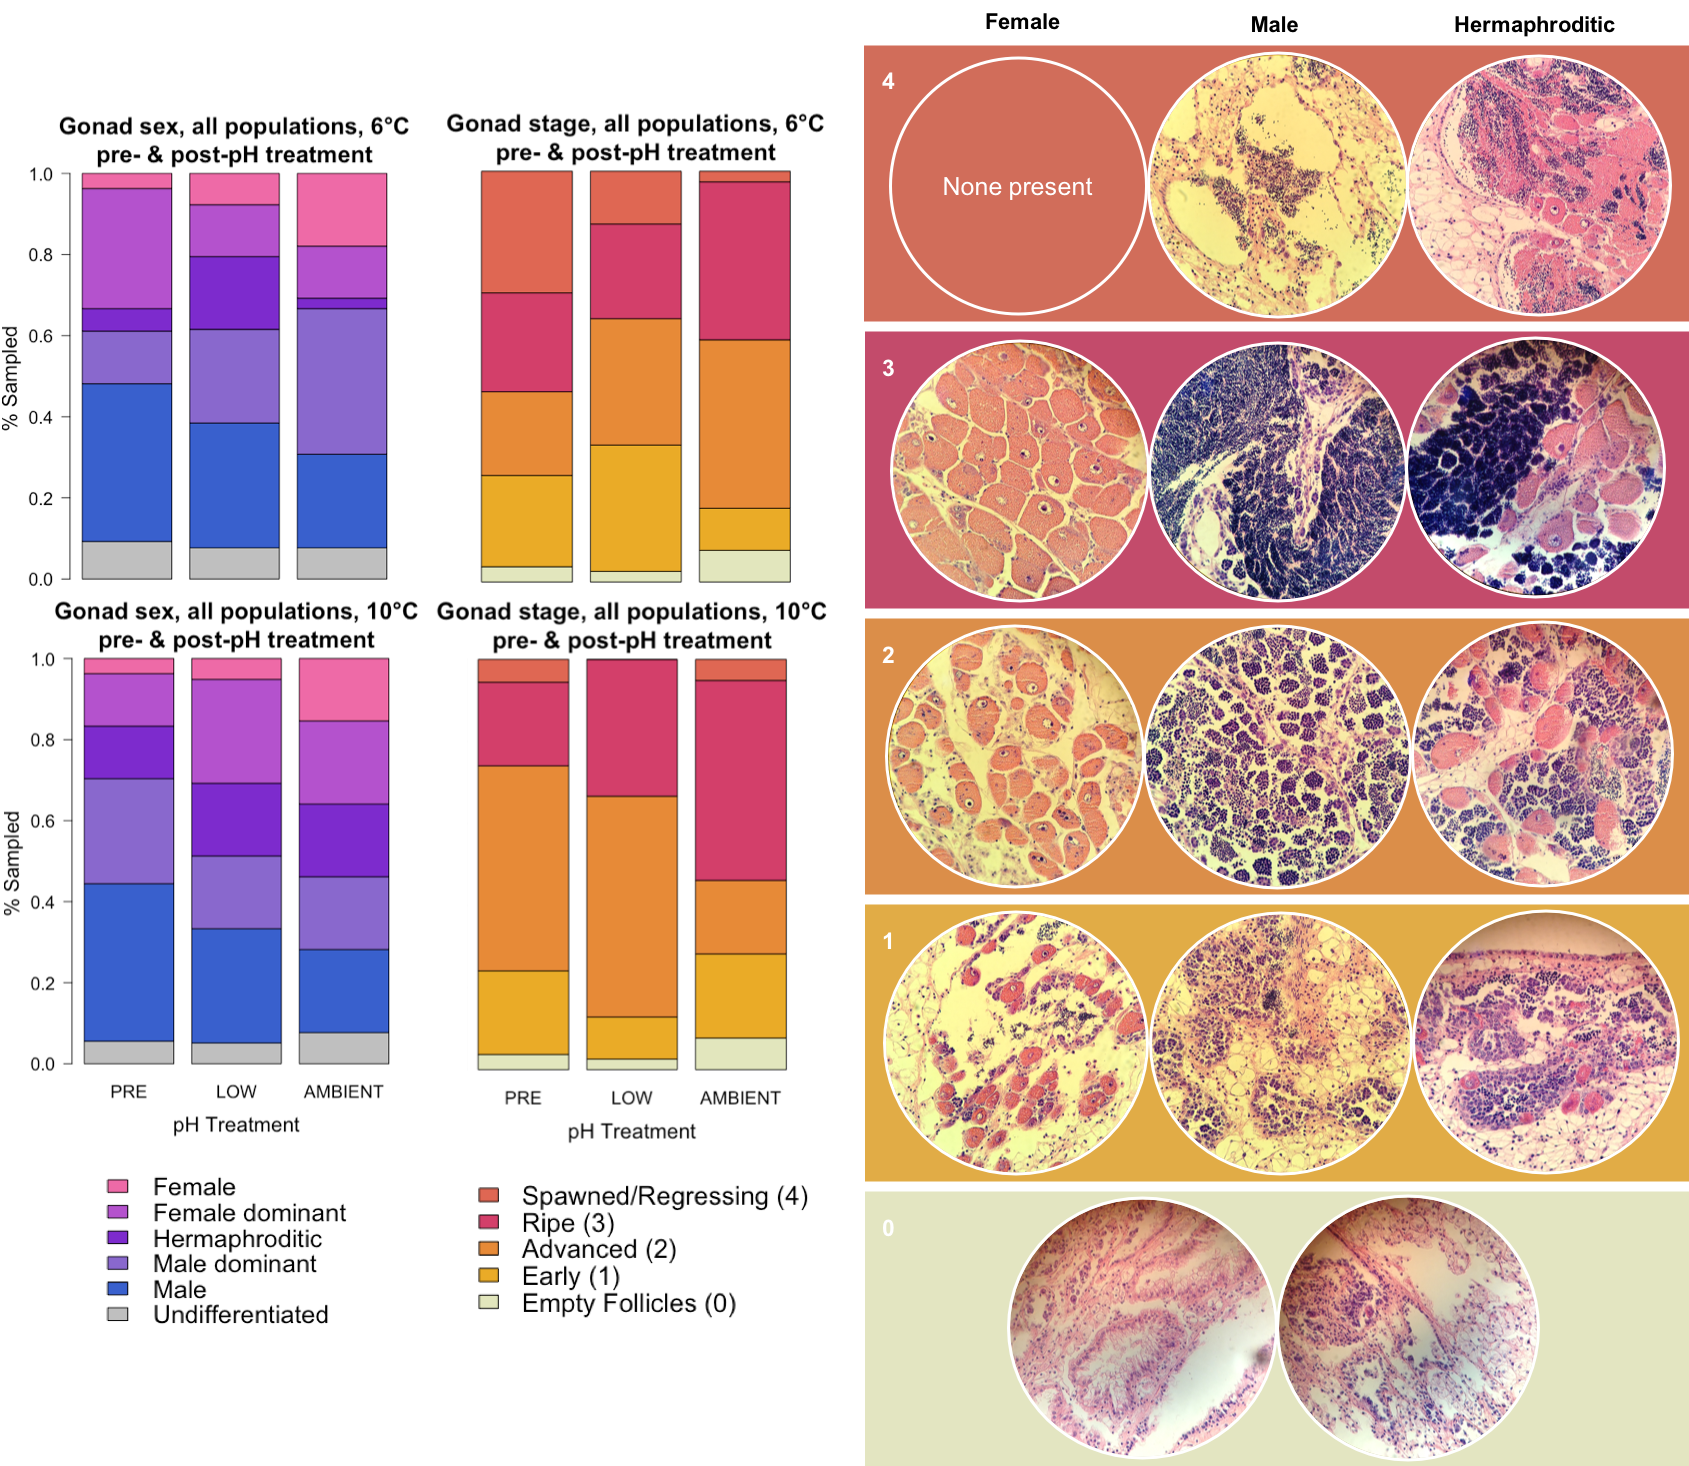
Both 6C and 10C gonad data, showing dominant stage, sex, and example gonad tissue for stages 0-4.
Dominant gonad stage (aka stage of domimant/assigned sex) differed between pH treatments, and between pre-treatment and ambient pH for both 6C and 10C groups (chi-square tests, p<0.05).
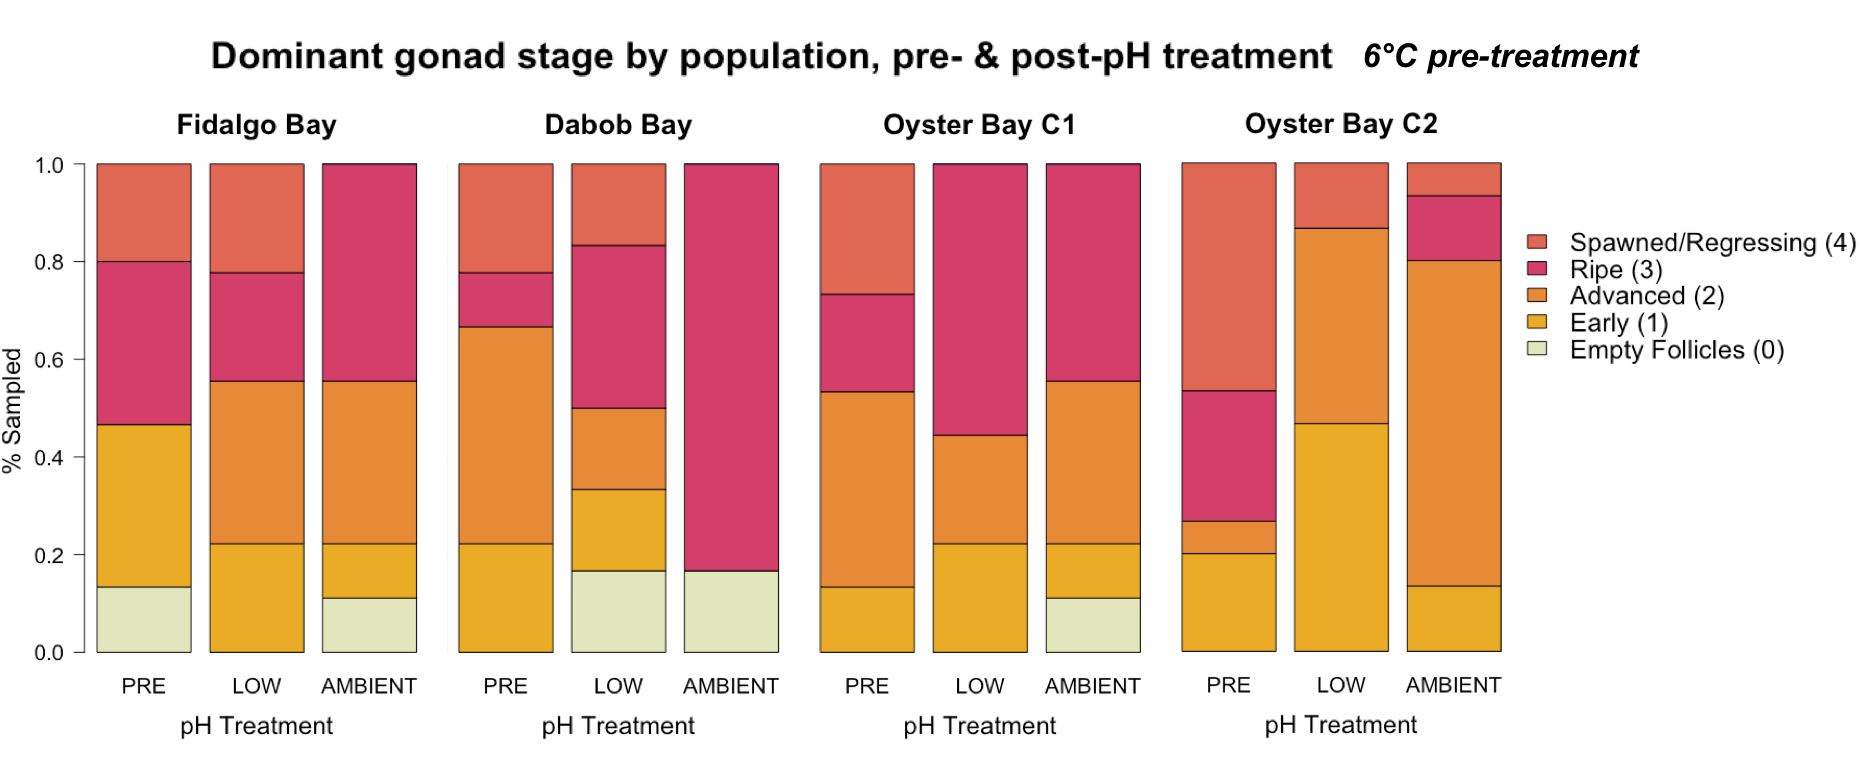
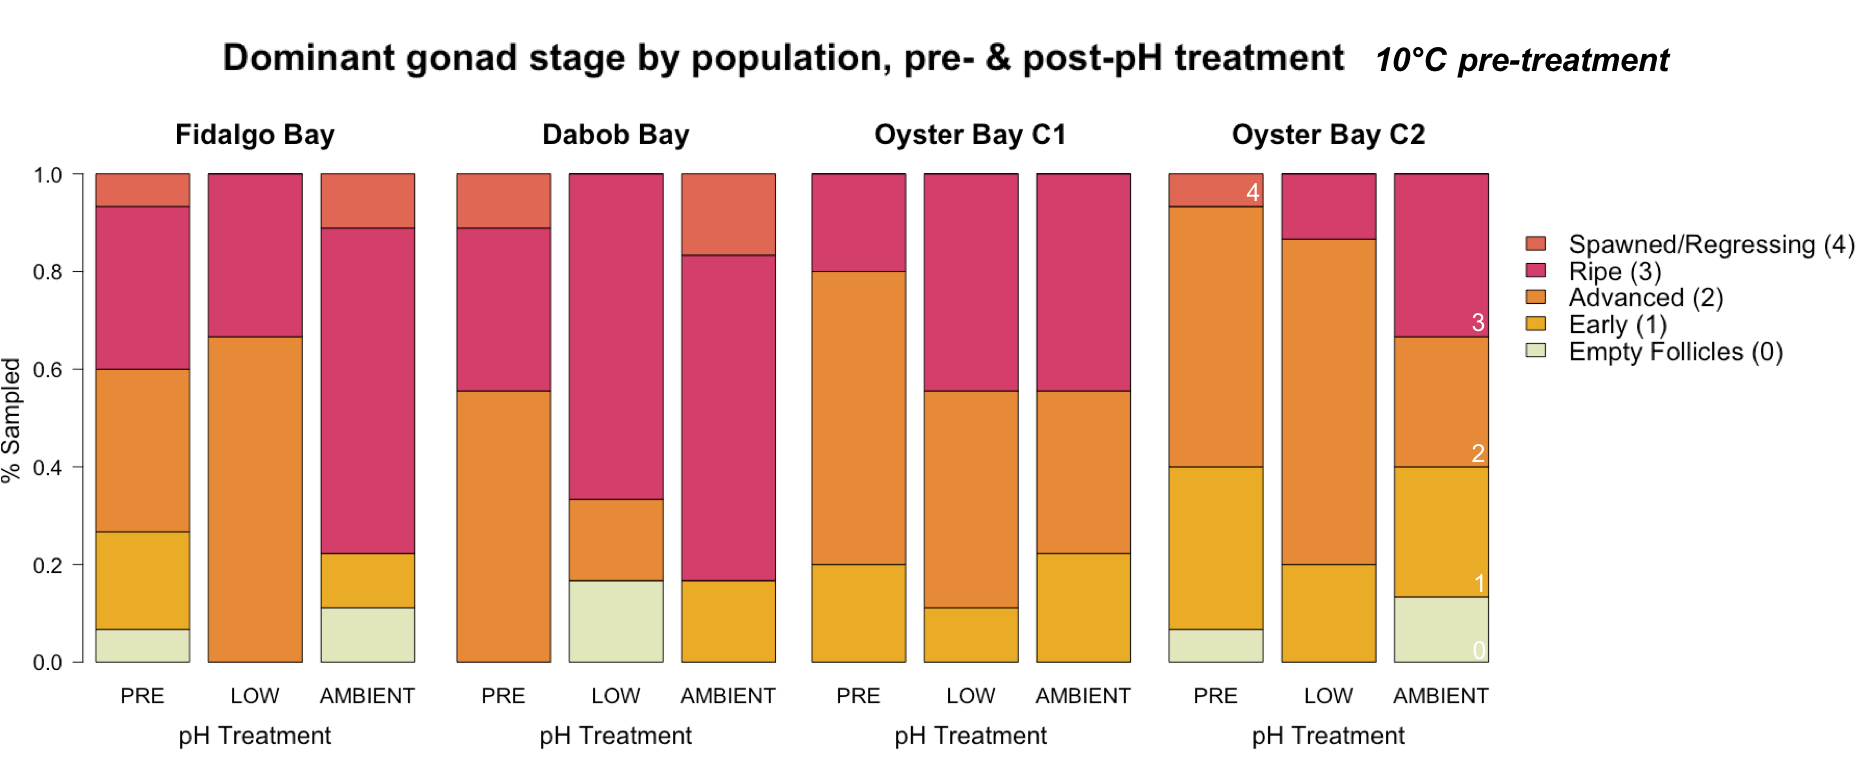
Dominant gonad stage by population, with 6C on top and 10C on bottom.
These plots represent the same gonad stage data as above, but broken down by population .
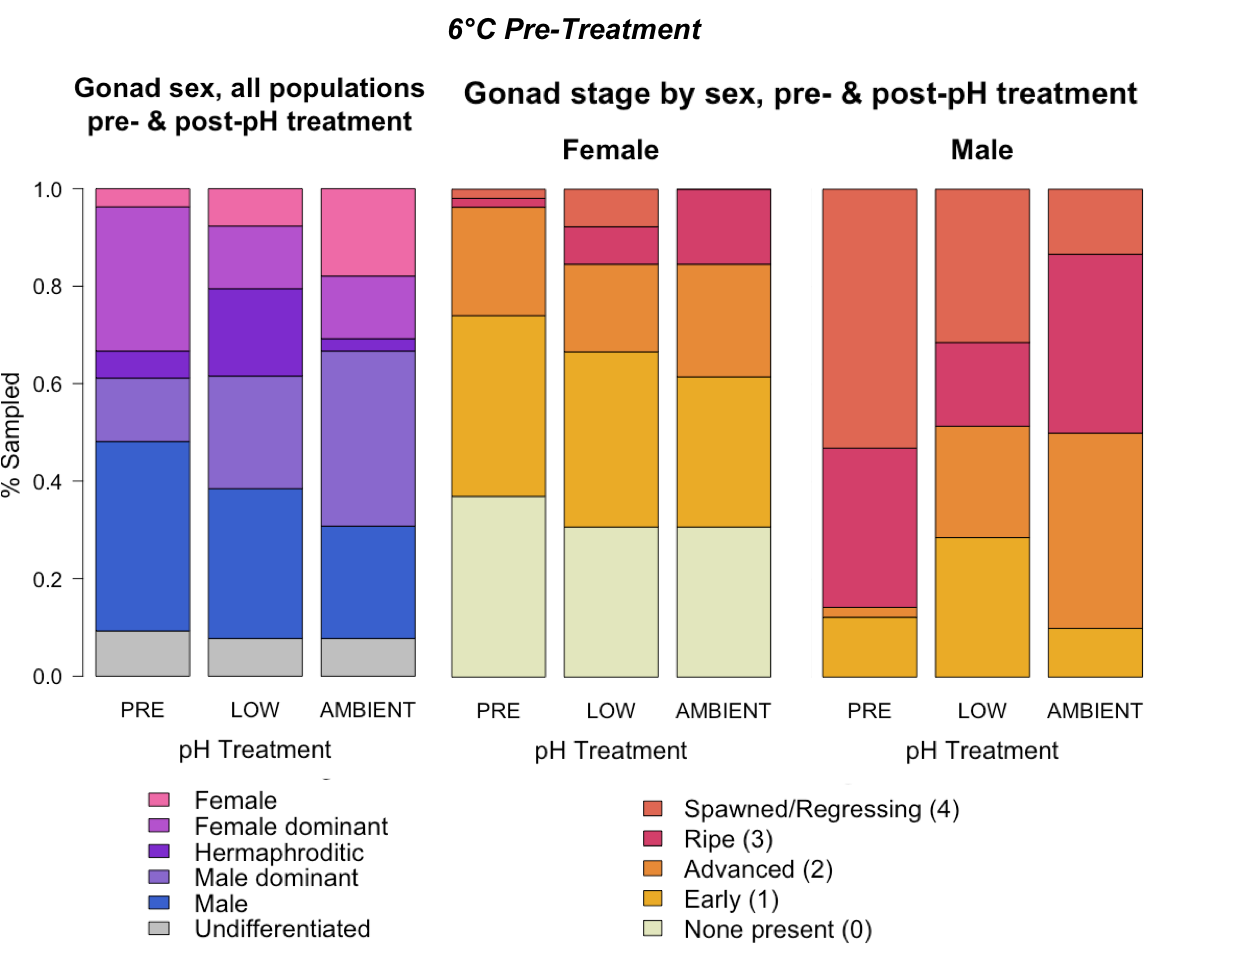
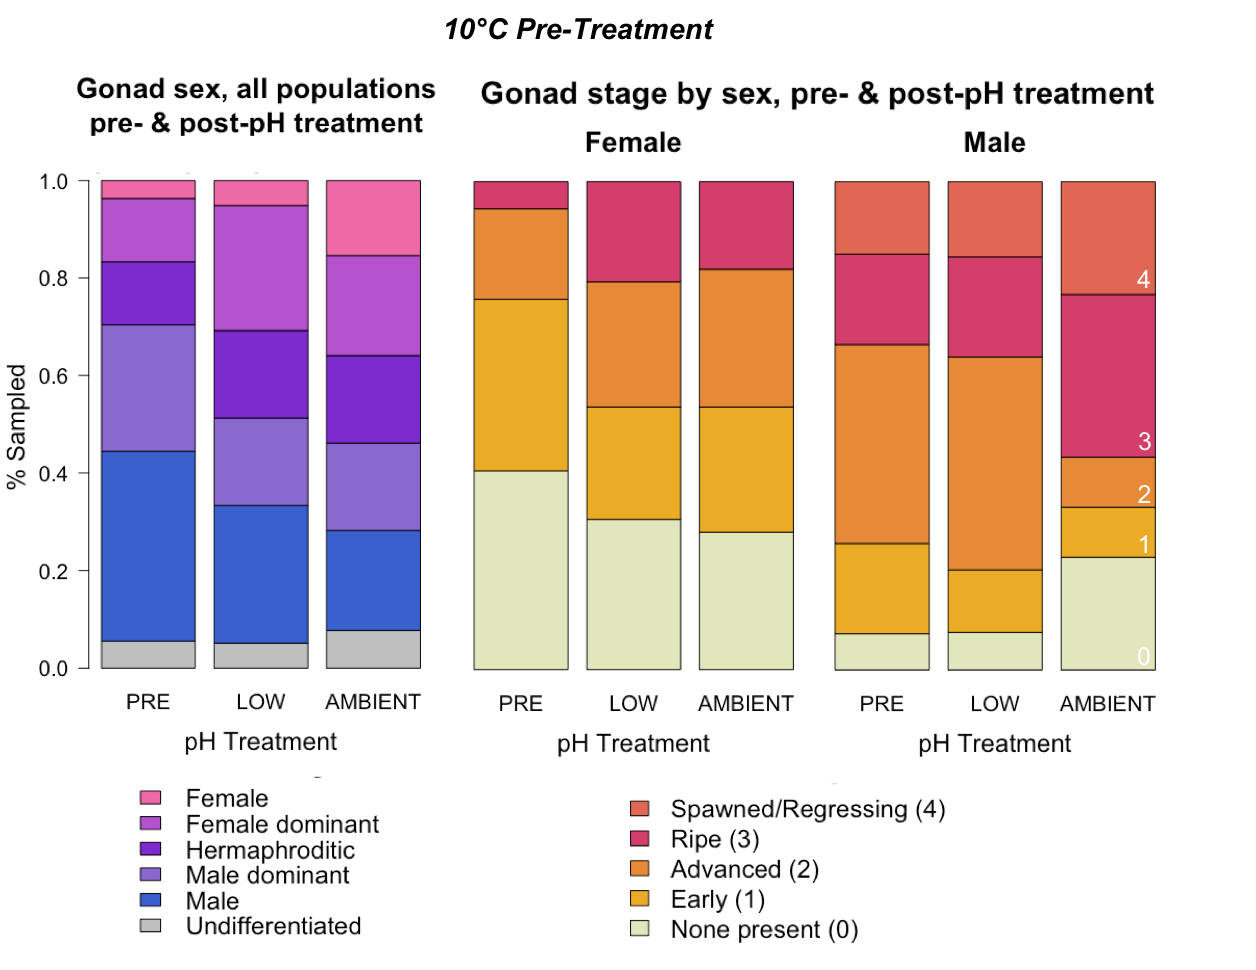
Gonad sex, female stage, and male stage for all populations.
In these plots, every oyster that was sampled is represented 3 times. I assigned stages for male and female gametocytes separately. For example, if an oyster contained majority ripe spermatids and minority advanced oocytes, that would appear as a male-dominant oyster in the Gonad sex plot, as a stage-2 in the Female plot, and stage 3 in the Male plot. Both pre-treatment temperature groups are shown- 6C on top and 10C on bottom.
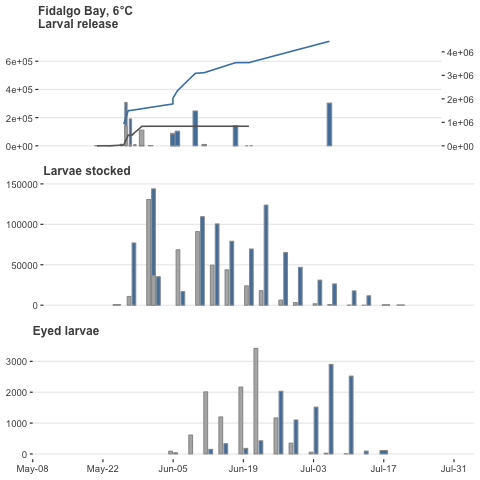
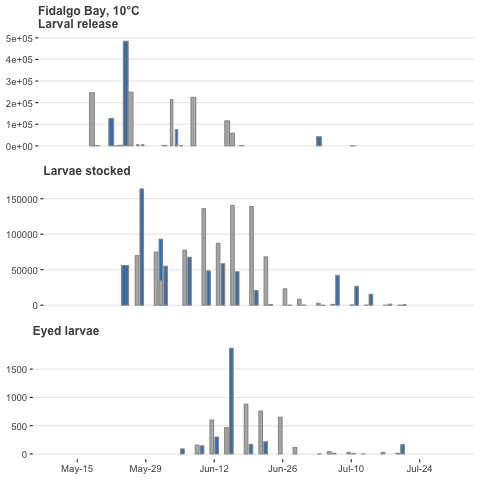
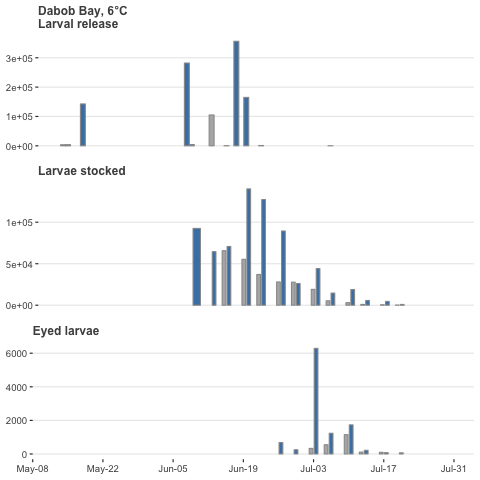
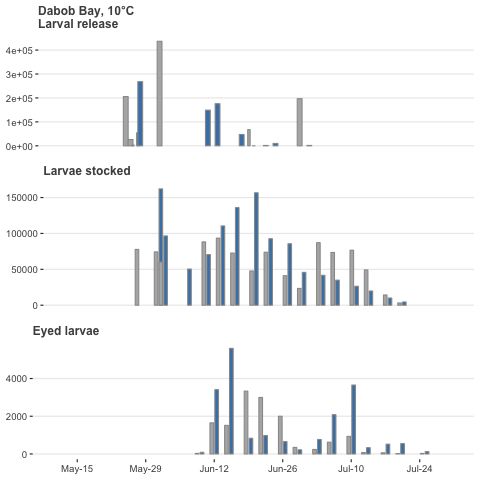
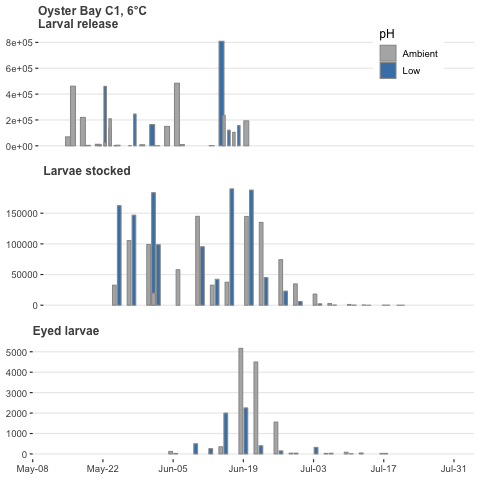
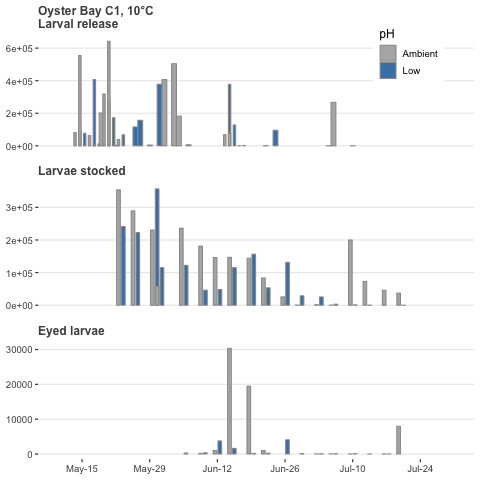
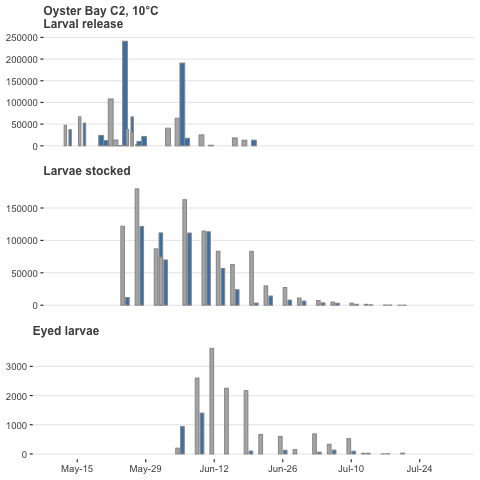
Larval plots by population - showing timing and magnitude of larval production, larvae stocked, and larvae reaching the eyed developmental phase (estimated by size, 224um).
Fidalgo Bay
 —
—
Dabob Bay
 —
—
Oyster Bay Cohort 1
 —
—
Oyster Bay Cohort 2
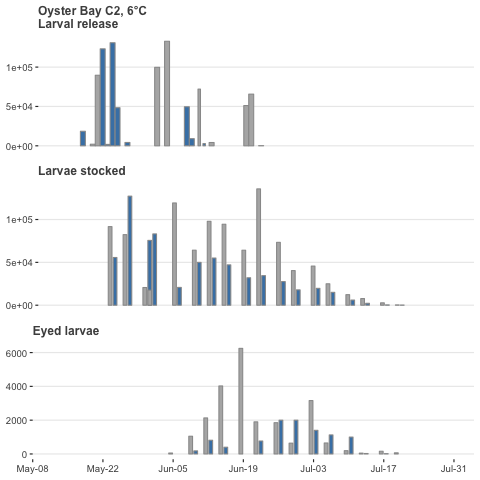 —
—
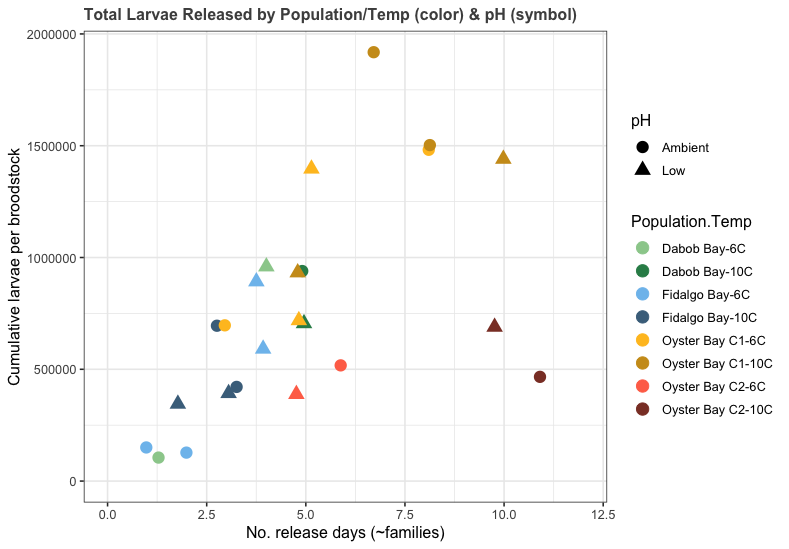
Cumulative larval production ~ No. of release days
This plot is a quick view of the total larvae produced per group. The y-axis is cumulative larvae produced, and the x-axis is number of release days (x-axis), which is an estimation of the # females that spawned successfully. The plots are color-coded by population and temperature (darker color = 10C), and symbols are pH. Notice that the Dabob Bay and Fidalgo Bay groups had 5 or fewer release days, and Oyster Bay groups (both Cohorts 1 and 2) spawned more frequently. Oyster Bay C2 were very small and compared to the other populations, thus the lower production/broodstock values.