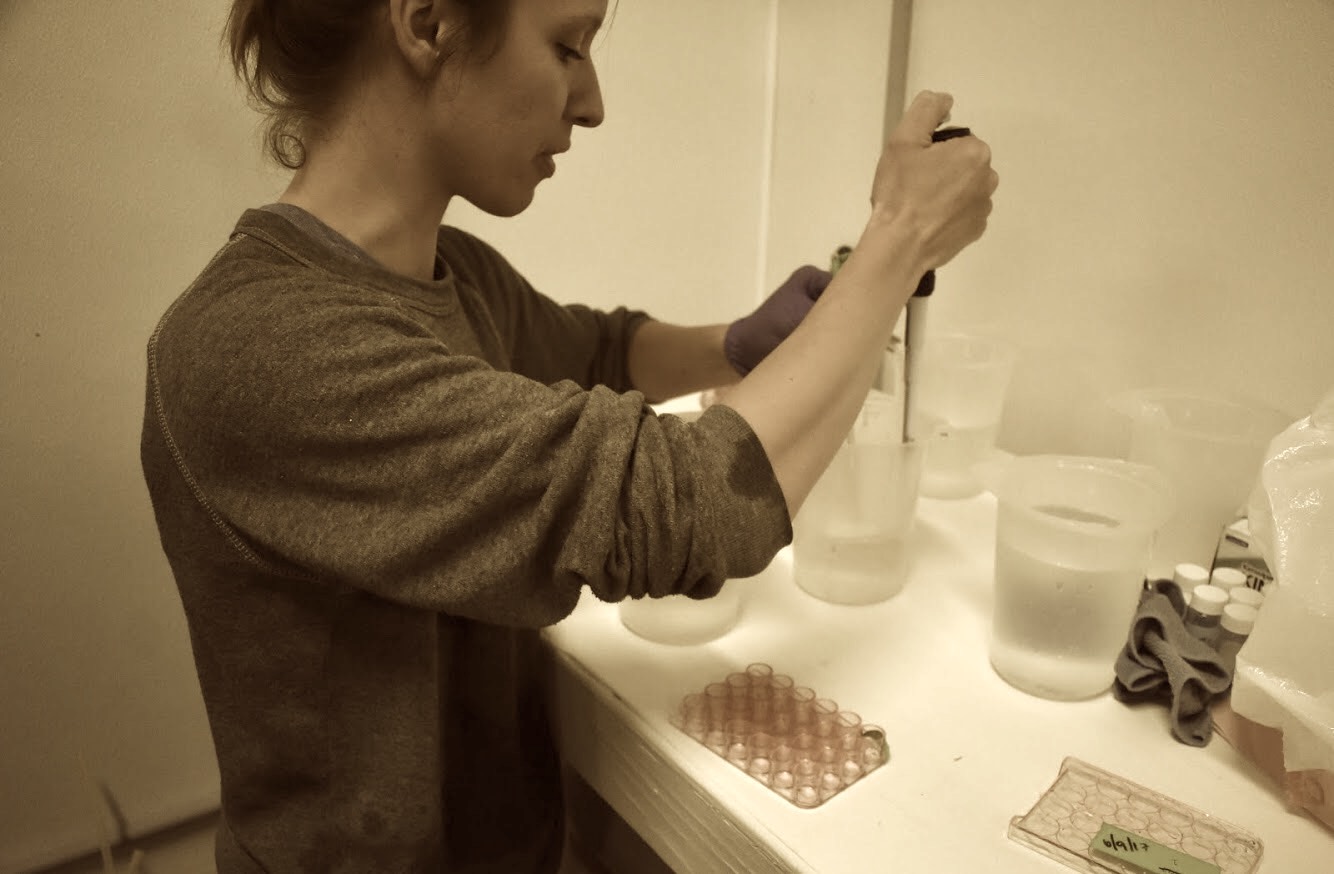
Oly temp experiment, 29 days of larvae
Larval production
Larval production data are in! It’s been 1 month of collecting and counting larvae released from four broodstock treatments, held for 3 months at the following, then induced to spawn under common conditions - 18C, food ad libitum.
- Low food, low temp (~7C)
- Low food, high temp (~10C)
- High food, low temp (~7C)
- High food, high temp (~10C)
The following plot shows cumulative larvae released over time for the four treatment groups, with four replicate spawning buckets per group. Number of released larvae have been normalized by the total oyster volume (measured via volume displacement). Total production does not appear to be influenced by treatment, but timing was. This is consistent with my results from last year’s project; see 2017 spawning charts. It’s interesting to see that, within temperature treatment, the low food groups spawned first, and that the limited feeding levels over winter did not significantly effect larval production.

Here is the total larval production data for each treatment/rep. Note, A1 and A2 (etc.) designate broodstock treatment tank reps 1, and 2 which I subsequently split into four total spawning buckets.
| Treatment | # Larvae | ~# Oysters |
|---|---|---|
| A1-1 | 6,012,828 | 32 |
| A1-2 | 3,136,527 | 34 |
| A2-1 | 3,712,154 | 31 |
| A2-2 | 995,396 | 28 |
| B1-1 | 3,694,952 | 33 |
| B1-2 | 3,423,074 | 34 |
| B2-1 | 4,882,010 | 36 |
| B2-2 | 2,952,781 | 37 |
| C1-1 | 3,094,754 | 28 |
| C1-2 | 2,463,644 | 23 |
| C2-1 | 1,775,235 | 19 |
| C2-2 | 1,759,988 | 19 |
| D1-1 | 3,530,963 | 34 |
| D1-2 | 3,388,931 | 37 |
| D2-1 | 2,691,880 | 32 |
| D2-2 | 3,879,053 | 35 |
| Total | 51,394,172 | 492 |
Here is the raw larval production data for a better idea of timing, and cells highlighted in blue indicate dates that I visually observed sperm/spawning activity via froth in the larval collection bucket (as shown in the middle bucket in the below image). On some days a few groups released larvae and spawned on the same day.

Larvae samples for size, lipid
Every day I collected larvae, I preserved samples in the -80. Samples were collected from 3/30-4/6 via killing with ethanol, transferring to 2mL microcentrifuge tube, then rinsing with ethanol to remove seawater, centrifuging for 1 min @ 2000g, and discarded supernatant. Then, I determiend that ethanol may interfere/remove some lipid content, so I altered the protocol to: rinse larvae with only DI water into microcentrifuge tubes, discarding DI supernatant, then into -80 immediately. Larvae are likely still alive upon transferring to freezer; the DI water simply causes them to close and sink, allowing for removal of supernatant. I preserved a total of 155 separate daily larval samples (with 2 or 3 reps for most). Plan is to look at lipid content and shell size.
Larval performance
To assess larval viability, I am rearing 12 families per broodstock treatment, 3 reps per family. I’ve stocked mini-silos with ~800 larvae. A family represents a subsample from one day of larval production from a bucket (must have spawned >100k larvae). Families were not stocked using two sequential release days from the same bucket, since I often observe larvae collected from the same bucket two days in a row (likely due to slow trickle/flow of larvae into catchment buckets). At week 2 post release, I rinse silos with fresh water, then sprinkle 0.5mL 224uM microcultch into each. When postset are 6 weeks old I will count survival and image for size.
Water Changes
Daily water changes are performed for the first 3 weeks for larval rearing mini-silo. Water changes include: collect 1L each diatom (CM) and flagellate (609) from the algae carboys (to ensure algae is void of ciliates), dilute with 6-8L FSW and count subsamples to determine algae concentration. Then, mix 30 gallons FSW + algae mix (determined via the below equation) for a 100,000 cells/mL medium. Fill tripours with 800mL mix, and transfer silos to new medium. At 3 weeks, water changes move to every other day. At week 6 I will move larvae into nylon mesh patches made from 450uM screen.
Volume Algae = (100,000 cells/mL) * (30 gal) / (algae concentration - 100,000 cells/mL)
Metrics
- Broodstock gonad sex & stage over time from November 30 -> March 23rd. 8 sampling dates for treatment groups, and 7 dates for Olys collected directly from Mud Bay on same day
- Broodstock gonad lipid, glycogen content
- Larval production
- Larval shell size, upon release
- Larvae lipid content, upon release
- Larval survival
- Post-set size, 6 weeks
