
Oly gonad statistics, 6-degree temperature only
In a previous post I generated pie charts of the 2017 Oly gonad stage and sex. Here, I run some quick stats on the gonad stage and sex data to confirm that my visually determined differences in maturation between 6degC low pH vs. 6degC ambient pH is, indeed, statistically different. I performed these analyses in R in my Histology-Pie-Charts.R script.
I created contingency tables to analyze differences in Sex and Stage, then ran chi-squared or Fisher’s exact tests, depending on sample size (small n = Fisher’s).
Contingency Table - All populations, by Sex
A warning was printed along with these results… “Warning message: In chisq.test(CT.Sex) : Chi-squared approximation may be incorrect”. So, I ran a Fisher’s Exact Test for Count Data instead of a chi-squared test:

Contingency Table - All populations, by Stage; Stages are significantly different between treatments, and indicate that low pH treatment resulted in more early-stage gonad.
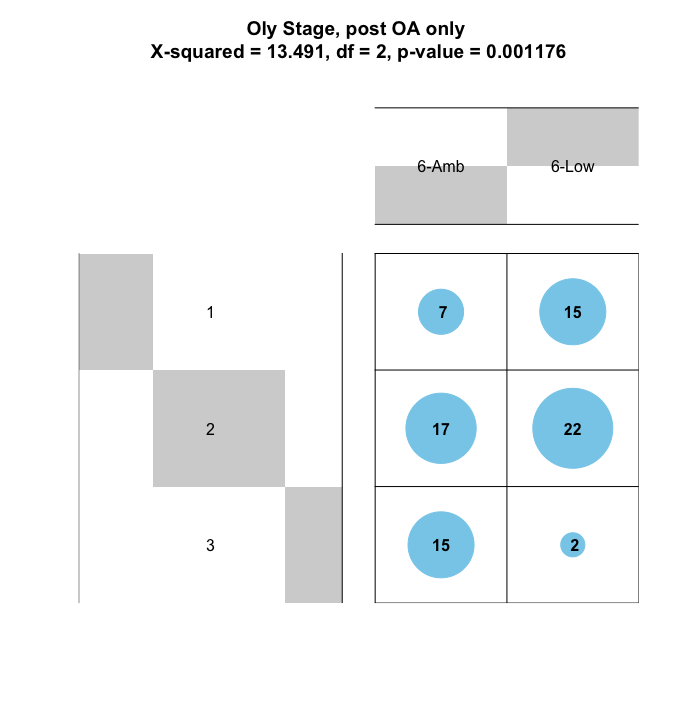
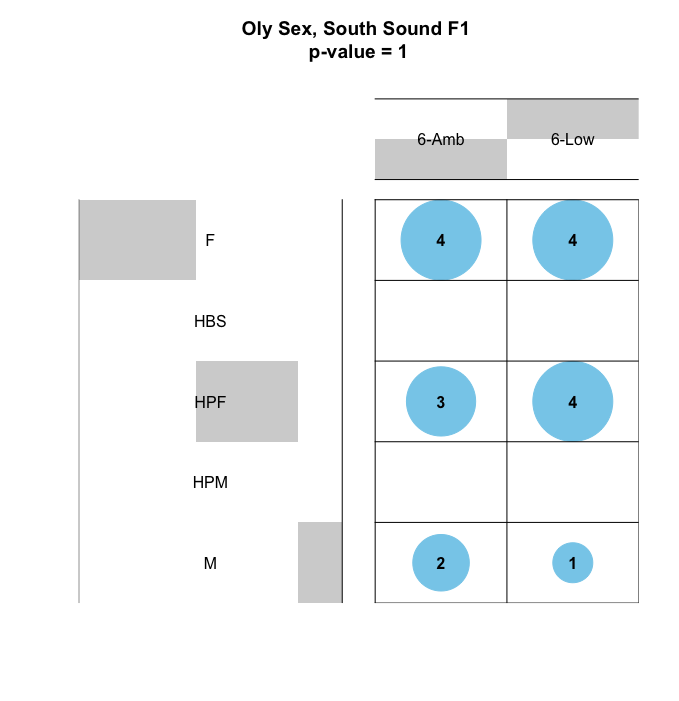
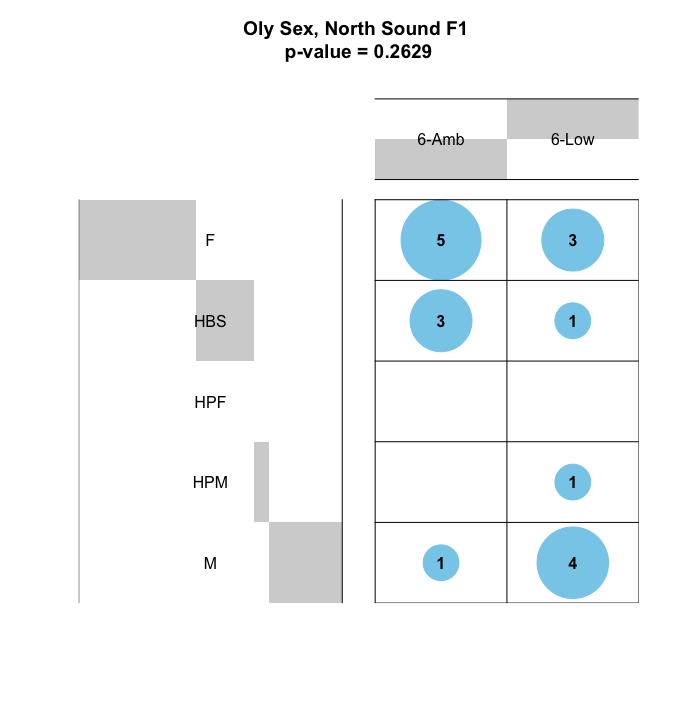
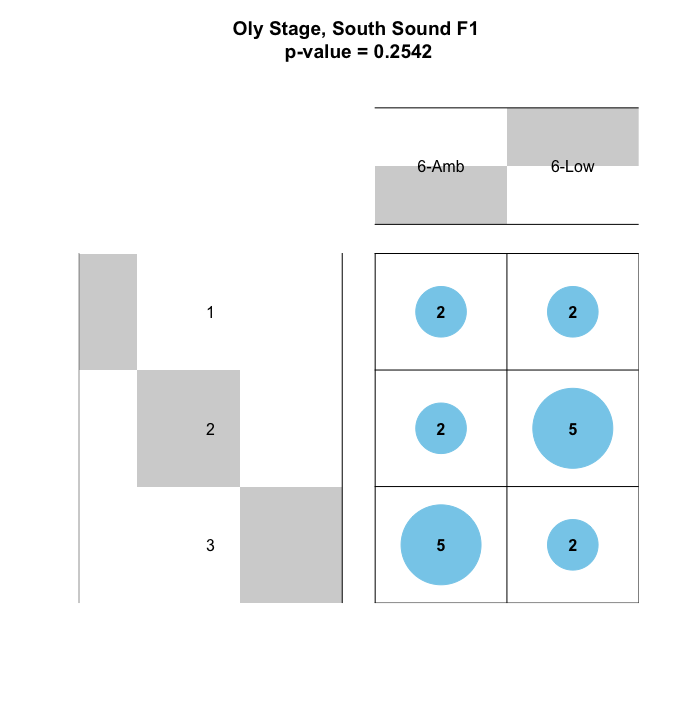
Let’s dial down into each poplulation. Bear with me here, there are a ton of contingency tables and stats results. Note I ran Fisher’s test for all these due to sample size:
Tables, by SEX


Tables, by STAGE:


Written on February 12, 2018